Three Dimensional Plotting in LaTeX

Colormap 3D surf TikZ Pgfplots LaTeX

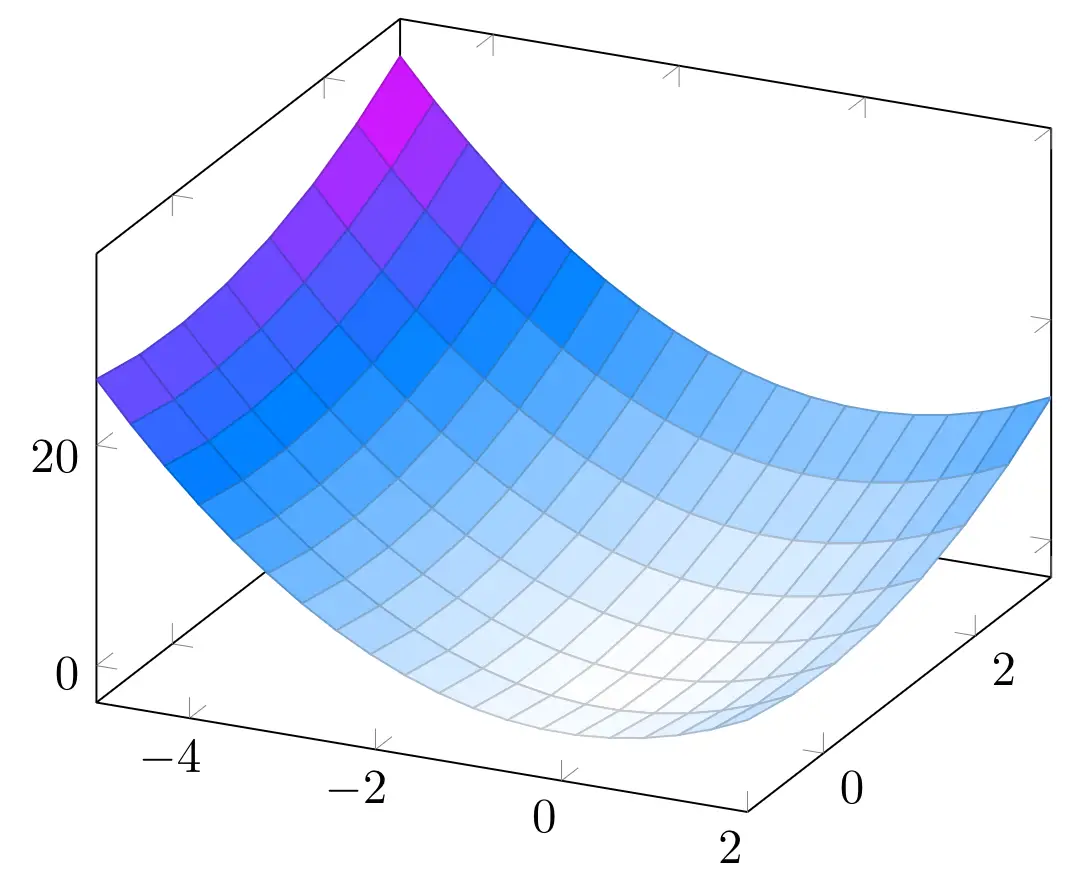
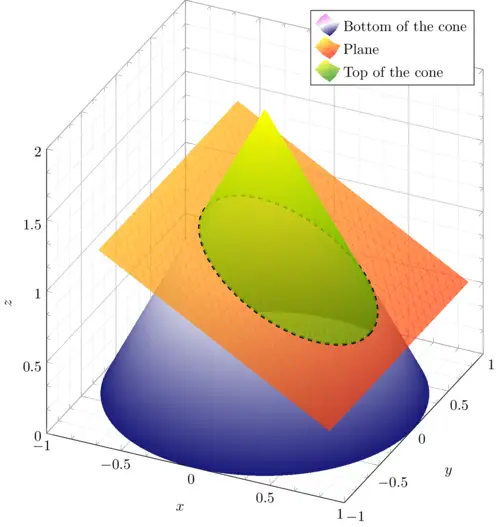
In this tutorial, we will learn how to plot 3D functions and data in LaTeX using Pgfplots package. We will learn also how to create scatter plots, mesh plots and surface plots. Moreover, we will see how to customize our plot: changing colors, line width, grid style, axis lines, colormaps and much more.

Draw a Plane Intersecting a Cone in LaTeX

Cone plane intersection in TikZ

In this tutorial, we will learn how to draw a plane intersecting a cone in LaTeX using TikZ and Pgfplots package. Finding the equation of the ellipse formed when a plane intersects a cone is a well know problem in geometry and it is beyond the scope of this post.

How to Plot a Function and Data in LaTeX

Plotting functions and data in LaTeX is quiet easy and this is possible thanks to the TikZ and Pgfplots packages. In this tutorial, we will learn how to plot functions from a mathematical expression or from a given data. Moreover, we will learn how to create axes, add labels and legend and change the graph style.