Setting up the LaTeX document
First we need to set up the LaTeX document by using the next code:
 \documentclass{standalone}

\usepackage{pgfplots}
\usepackage{tikz-3dplot}

\tdplotsetmaincoords{60}{115}
\pgfplotsset{compat=newest}

\begin{document}

\begin{tikzpicture}[]
	% Here goes the code
\end{tikzpicture}

\end{document}
Remember that here we use the standalone as documentclass. This document class fits the size of the page to the size of the illustration, but of course you can use any document class.
We need to load the supporting packages pgfplots and tikz-3dplot. It should be noted that these packages are built on TikZ which means that TikZ is also loaded. In our example we've used \tdplotsetmaincoords{60}{115} to set up a desired angle of visualization, you can put different values to get a different point of view of the 3D drawing.
Draw Lines in 3d coordinates
Once you have completed the set up of the document, you can start drawing. The most important command in TikZ is \draw[options]. This command is used to draw lines, arrows, circle, and any basic shape. Depending of the options provided to the draw command, you can get different types of lines like dashed or dotted, and also you can specify the stroke of the line like thin or thick. For example if you write -stealth in the options you will get a line with an arrowhead (check this post for more details about TikZ arrows).
The following code:
\documentclass[border=0.2cm]{standalone}

\usepackage{pgfplots}
\usepackage{tikz-3dplot}

\tdplotsetmaincoords{60}{115}
\pgfplotsset{compat=newest}

\begin{document}

\begin{tikzpicture}[tdplot_main_coords, scale = 2.5]

% Create a point (P)
\coordinate (P) at ({1/sqrt(3)},{1/sqrt(3)},{1/sqrt(3)});

% Projection of the point on X and y axes
\draw[thin, dashed] (P) --++ (0,0,{-1/sqrt(3)});
\draw[thin, dashed] ({1/sqrt(3)},{1/sqrt(3)},0) --++
(0,{-1/sqrt(3)},0);
\draw[thin, dashed] ({1/sqrt(3)},{1/sqrt(3)},0) --++
({-1/sqrt(3)},0,0);

% Axes in 3 d coordinate system
\draw[-stealth] (0,0,0) -- (1.80,0,0);
\draw[-stealth] (0,0,0) -- (0,1.30,0);
\draw[-stealth] (0,0,0) -- (0,0,1.30);
\draw[dashed, gray] (0,0,0) -- (-1,0,0);
\draw[dashed, gray] (0,0,0) -- (0,-1,0);

% Line from the origin to (P)
\draw[thick, -stealth] (0,0,0) -- (P);

\end{tikzpicture}

\end{document}
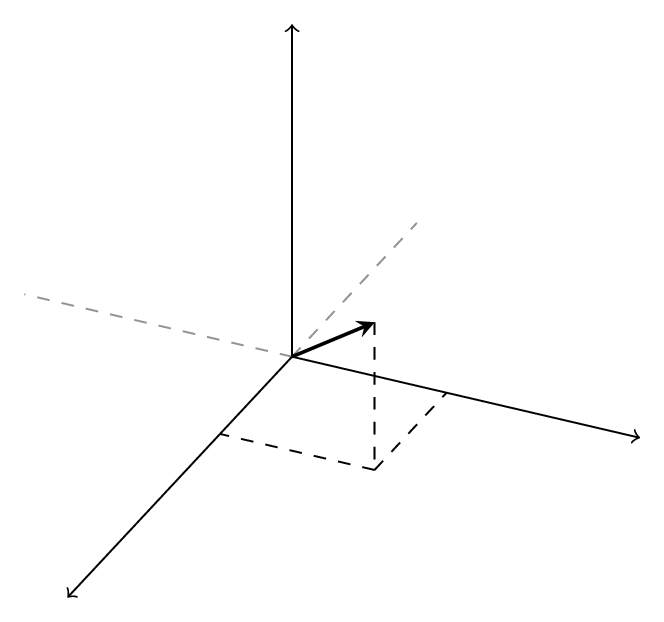
yields:

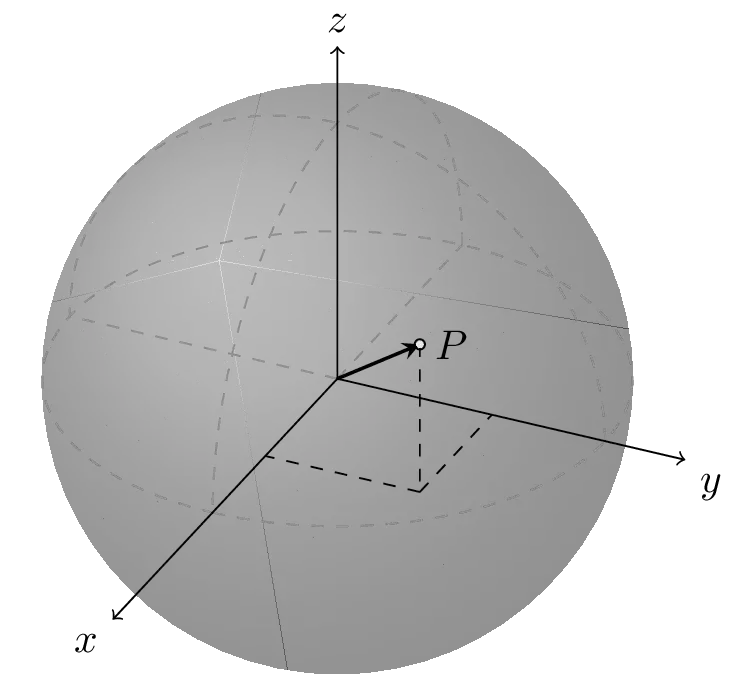
In the previous code, we use the command \coordinate to define a point on the surface of the sphere. We have choosen the point (1/√3,1/√3,1/√3), which corresponds to a point on the surface of a sphere of radius 1.
In the options of the tikzpicture environment we need to add tdplot_main_coords in order to make sure we are using the angles of visualization defined previously. Also we specified the scale of the picture by using the scale command, here we use a factor of 2.5.
Draw an arc in 3d coordinates
The next step is very simple. We have to draw arcs to make a wireframe structure of the sphere. For this purpose we can use again the \draw command, but also we have to use the \tdplotsetrotatedcoords{a}{b}{c} command, which allows us to rotate the arcs around the coordinate axes. Here is the corresponding code:
\documentclass[border=0.2cm]{standalone}

\usepackage{pgfplots}
\usepackage{tikz-3dplot}

\tdplotsetmaincoords{60}{115}
\pgfplotsset{compat=newest}

\begin{document}

\begin{tikzpicture}[tdplot_main_coords, scale = 2.5]

% Create a point (P)
\coordinate (P) at ({1/sqrt(3)},{1/sqrt(3)},{1/sqrt(3)});

% draw arcs
\tdplotsetrotatedcoords{0}{0}{0};
\draw[dashed,
	tdplot_rotated_coords,
	gray
] (0,0,0) circle (1);

\tdplotsetrotatedcoords{90}{90}{90};
\draw[dashed,
	tdplot_rotated_coords,
	gray
] (1,0,0) arc (0:180:1);

\tdplotsetrotatedcoords{0}{90}{90};
\draw[dashed,
	tdplot_rotated_coords,
	gray
] (1,0,0) arc (0:180:1);

% Projection of the point on X and y axes
\draw[thin, dashed] (P) --++ (0,0,{-1/sqrt(3)});
\draw[thin, dashed] ({1/sqrt(3)},{1/sqrt(3)},0) --++
(0,{-1/sqrt(3)},0);
\draw[thin, dashed] ({1/sqrt(3)},{1/sqrt(3)},0) --++
({-1/sqrt(3)},0,0);

% Axes in 3 d coordinate system
\draw[-stealth] (0,0,0) -- (1.80,0,0);
\draw[-stealth] (0,0,0) -- (0,1.30,0);
\draw[-stealth] (0,0,0) -- (0,0,1.30);
\draw[dashed, gray] (0,0,0) -- (-1,0,0);
\draw[dashed, gray] (0,0,0) -- (0,-1,0);

% Line from the origin to (P)
\draw[thick, -stealth] (0,0,0) -- (P);

\end{tikzpicture}

\end{document}
Check how you have to choose the correct angles of rotation to get the desired shapes. This can be confusing at the beginning, but once you learn how to use it correctly is very easy and useful.
Plot sphere in LaTeX
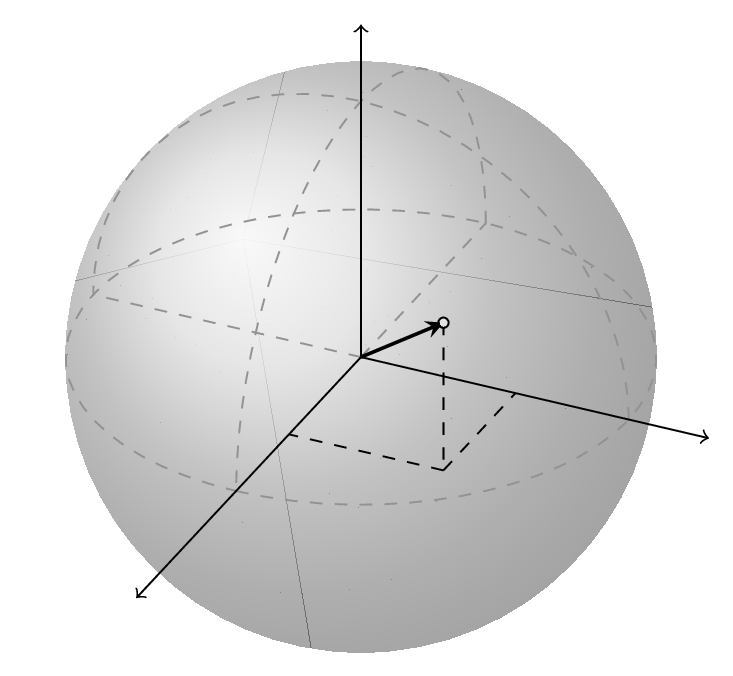
Now it comes the magic. We have until now a wireframe sphere, but it looks plain. To make it look as a true sphere we can use a shaded effect which is actually a trick since we are not plotting any sphere for real but a illusion of a sphere. To achieve the effect, we can use the command \shade as shown below:
\documentclass[border=0.2cm]{standalone}

\usepackage{pgfplots}
\usepackage{tikz-3dplot}

\tdplotsetmaincoords{60}{115}
\pgfplotsset{compat=newest}

\begin{document}

\begin{tikzpicture}[tdplot_main_coords, scale = 2.5]

% Create a point (P)
\coordinate (P) at ({1/sqrt(3)},{1/sqrt(3)},{1/sqrt(3)});

% Draw shaded circle
\shade[ball color = lightgray,
	opacity = 0.5
] (0,0,0) circle (1cm);

% draw arcs
\tdplotsetrotatedcoords{0}{0}{0};
\draw[dashed,
	tdplot_rotated_coords,
	gray
] (0,0,0) circle (1);

\tdplotsetrotatedcoords{90}{90}{90};
\draw[dashed,
	tdplot_rotated_coords,
	gray
] (1,0,0) arc (0:180:1);

\tdplotsetrotatedcoords{0}{90}{90};
\draw[dashed,
	tdplot_rotated_coords,
	gray
] (1,0,0) arc (0:180:1);

% Projection of the point on X and y axes
\draw[thin, dashed] (P) --++ (0,0,{-1/sqrt(3)});
\draw[thin, dashed] ({1/sqrt(3)},{1/sqrt(3)},0) --++
(0,{-1/sqrt(3)},0);
\draw[thin, dashed] ({1/sqrt(3)},{1/sqrt(3)},0) --++
({-1/sqrt(3)},0,0);

% Axes in 3 d coordinate system
\draw[-stealth] (0,0,0) -- (1.80,0,0);
\draw[-stealth] (0,0,0) -- (0,1.30,0);
\draw[-stealth] (0,0,0) -- (0,0,1.30);
\draw[dashed, gray] (0,0,0) -- (-1,0,0);
\draw[dashed, gray] (0,0,0) -- (0,-1,0);

% Line from the origin to (P)
\draw[thick, -stealth] (0,0,0) -- (P);

% Add small circle at (P)
\draw[fill = lightgray!50] (P) circle (0.5pt);

\end{tikzpicture}

\end{document}
Compiling this code yields:

Add labels to axes
Finally, to annotate the drawing and locate the labels of axis and points we can use the \node[location] {label} syntax after each coordinate to be annotated. Here is the final code:
\documentclass[border=0.2cm]{standalone}

\usepackage{pgfplots}
\usepackage{tikz-3dplot}

\tdplotsetmaincoords{60}{115}
\pgfplotsset{compat=newest}

\begin{document}

\begin{tikzpicture}[tdplot_main_coords, scale = 2.5]

% Create a point (P)
\coordinate (P) at ({1/sqrt(3)},{1/sqrt(3)},{1/sqrt(3)});

% Draw shaded circle
\shade[ball color = lightgray,
	opacity = 0.5
] (0,0,0) circle (1cm);

% draw arcs
\tdplotsetrotatedcoords{0}{0}{0};
\draw[dashed,
	tdplot_rotated_coords,
	gray
] (0,0,0) circle (1);

\tdplotsetrotatedcoords{90}{90}{90};
\draw[dashed,
	tdplot_rotated_coords,
	gray
] (1,0,0) arc (0:180:1);

\tdplotsetrotatedcoords{0}{90}{90};
\draw[dashed,
	tdplot_rotated_coords,
	gray
] (1,0,0) arc (0:180:1);

% Projection of the point on X and y axes
\draw[thin, dashed] (P) --++ (0,0,{-1/sqrt(3)});
\draw[thin, dashed] ({1/sqrt(3)},{1/sqrt(3)},0) --++
(0,{-1/sqrt(3)},0);
\draw[thin, dashed] ({1/sqrt(3)},{1/sqrt(3)},0) --++
({-1/sqrt(3)},0,0);

% Axes in 3 d coordinate system
\draw[-stealth] (0,0,0) -- (1.80,0,0)
	node[below left] {$x$};

\draw[-stealth] (0,0,0) -- (0,1.30,0)
	node[below right] {$y$};

\draw[-stealth] (0,0,0) -- (0,0,1.30)
	node[above] {$z$};

\draw[dashed, gray] (0,0,0) -- (-1,0,0);
\draw[dashed, gray] (0,0,0) -- (0,-1,0);

% Line from the origin to (P)
\draw[thick, -stealth] (0,0,0) -- (P) node[right] {$P$};

% Add small circle at (P)
\draw[fill = lightgray!50] (P) circle (0.5pt);

\end{tikzpicture}

\end{document}
