
Short description
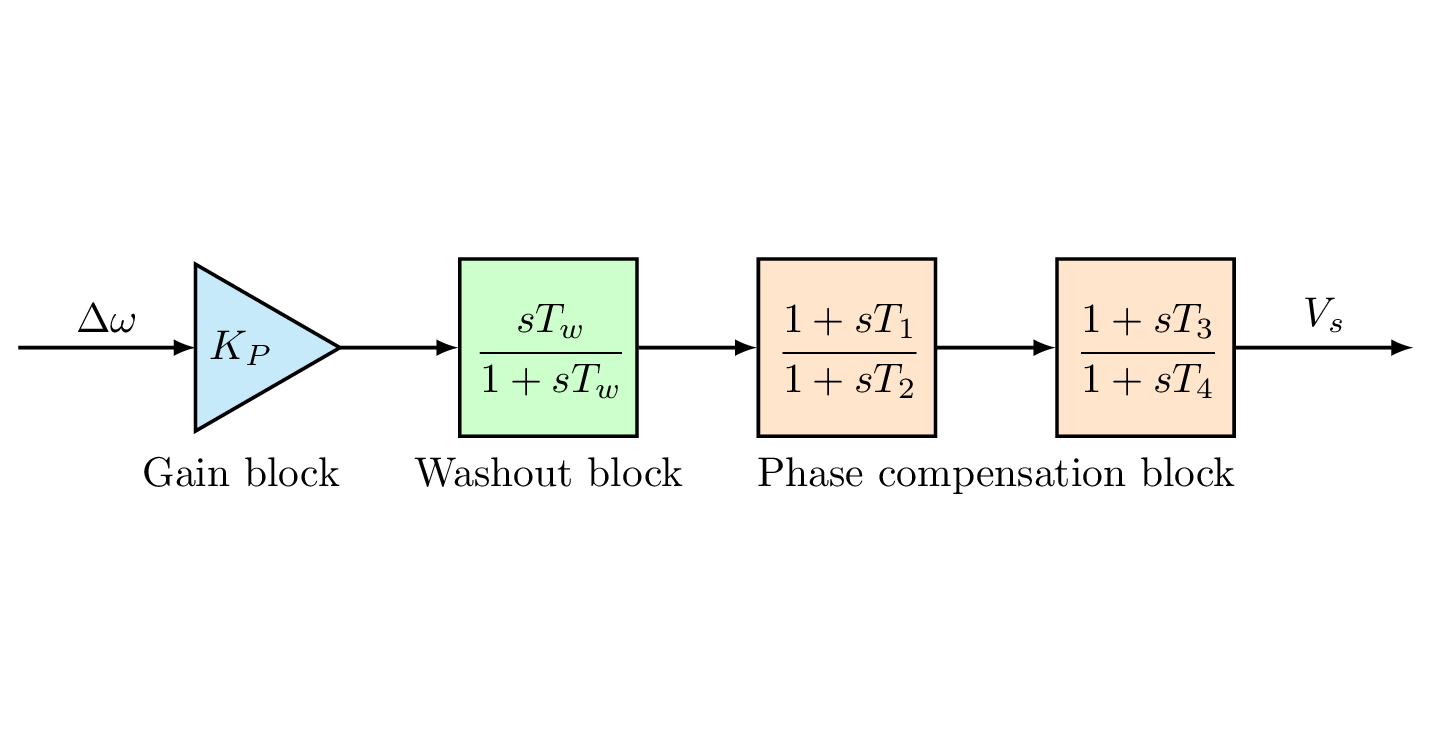
From the above illustration, we distinguish two different shapes: triangle for the gain block and rectangle for different transfer functions. In TikZ, we can draw these shapes using \draw command or we using predefined node shapes. The latter is the best option as it allows us to get coordinates of the border shape which can be used to connect blocks without computing the border coordinates.
Labels can be added using \node command below each block except the phase compensation block label which will be added below the midway point between the two orange blocks.
Related posts
- I invite you to read this step by step tutorial about drawing block diagrams in LaTeX to get the general idea about drawing block diagrams in LaTeX using TikZ package.
- Then, you can check this short post about the TikZ tringle shape, it teaches you how to draw and customize isosceles triangle node shape.
- To get the coordinates of the midway point between two nodes, we can use barycentric coordinate system in TikZ, check this section in How to draw Venn diagrams in LaTeX tutorial.
- To get an idea about different TikZ Arrow tips, check this tutorial.
LaTeX code of the Power System Stabilizer Block Diagram
Here is the LaTeX code of PSS block diagram drawn using TikZ:
 \documentclass[border=0.2cm]{standalone}

% Required packages and libraries
\usepackage{tikz,amsmath}

\usetikzlibrary{shapes.geometric,positioning}

\begin{document}

\begin{tikzpicture}[thick,
	gain/.style = {
		draw,
		isosceles triangle,
		isosceles triangle apex angle=60,
		minimum height = 2em,
		outer sep=0},
	TFblock/.style= {
		draw,
		minimum size=1.5cm}]

% Gain block
\node [gain,fill=cyan!20] (a) {$K_P$};

% Washout Filter Block
\node [TFblock,fill=green!20,] (b) [right= of a] {$\cfrac{sT_{w}}{1+sT_w}$};

% Phase Compensation Block
\node [TFblock,fill=orange!20] (c) [right =of b] {$\cfrac{1+sT_{1}}{1+sT_2}$};
\node [TFblock,fill=orange!20] (d)[right =of c] {$\cfrac{1+sT_{3}}{1+sT_4}$};

% Arrows
\draw[-latex] (a.west)++(-1.5,0) edge node[above] {$\Delta \omega$} (a.west)
	(a.east) edge (b.west)
	(b.east) edge (c.west)
	(c.east) edge (d.west)
	(d.east) -- node[above] {$V_s$} ++(1.5,0) ;

% Labels
\node[below=0.8cm] at (a){ Gain block};
\node[below=0.8cm] at (b){ Washout block};
\node[below=0.8cm] at (barycentric cs:c=1,d=1){ Phase compensation block};

\end{tikzpicture}

\end{document}Comments:
- We loaded shapes.geometric library to be able to draw the isosceles triangle.
- positioning library allows us to add nodes relative to each other (e.g. right=of nodeName).
- We created two styles, one for the gain block (named gain) and one for transfer function blocks (named TFblock).
- We used barycentric coordinate system to get the midway point between node c and node d. All labels are 0.8cm far from the node center (horizontal line of the block diagram).
PSS block diagram in TikZ (Updated code)
Special thanks to lurking_bishop from reddit, I've received a comment about optimizing the labels' part. From the previous code, you can remark that the three labels positions are independent. This means if you change one, you have to do the same for the rest.
Now, the idea is to save the coordinates of one label, let's say the "gain block", and compute coordinates of the rest. These coordinates correspond to the intersection of a horizontal line passing through the "gain block" coordinate and a vertical line passing through the "TFblock" node center. Now all labels' positions are controlled by the first label position. Here is the updated code:
 \documentclass[border=0.2cm]{standalone}

% Required packages and libraries
\usepackage{tikz,amsmath}

\usetikzlibrary{shapes.geometric,positioning}

\begin{document}

\begin{tikzpicture}[thick,
	gain/.style = {
		draw,
		isosceles triangle,
		isosceles triangle apex angle=60,
		minimum height = 2em,
		outer sep=0},
	TFblock/.style= {
		draw,
		minimum size=1.5cm}]

% Gain block
\node [gain,fill=cyan!20] (a) {$K_P$};

% Washout Filter Block
\node [TFblock,fill=green!20,] (b) [right= of a] {$\cfrac{sT_{w}}{1+sT_w}$};

% Phase Compensation Block
\node [TFblock,fill=orange!20] (c) [right =of b] {$\cfrac{1+sT_{1}}{1+sT_2}$};
\node [TFblock,fill=orange!20] (d)[right =of c] {$\cfrac{1+sT_{3}}{1+sT_4}$};

% Arrows
\draw[-latex] (a.west)++(-1.5,0) edge node[above] {$\Delta \omega$} (a.west)
	(a.east) edge (b.west)
	(b.east) edge (c.west)
	(c.east) edge (d.west)
	(d.east) -- node[above] {$V_s$} ++(1.5,0) ;

% Labels
\node[below=0.8cm] (x) at (a){ Gain block};
\node at (x-|b){ Washout block};
\node at (x-| {barycentric cs:c=1,d=1}){ Phase compensation block};

\end{tikzpicture}

\end{document}