What is a Venn Diagram?
Venn diagram, known also as set diagram, was invented by John Venn around 1880. It consists of overlapping circles or other shapes to illustrate the logical relationships between two or more sets of things.
Before starting with Venn Diagrams, Let's learn how to draw circles and add labels in LaTeX using TikZ package.
How to draw a circle in TikZ?
Drawing a circle in LaTeX using TikZ can be done using one of the following methods:
- Method 1: using \draw command and circle operation as follows:
\draw (x,y) circle(r);
The above line code draws a circle at the center with coordinates (x,y) and radius r.
- Method 2: using node command with draw, circle and minimum size=<value> options:
\node[draw,circle,minimum size=2cm] (name) at (x,y){CircleContent};The advantage of this method is that we can access the circle borders coordinates, add label and draw other circles using relative positioning. I deeply invite you to check this post TikZ shapes: Circle
How to add label to a node in TikZ?
Adding a label to a node can be achieved using label=<text> option with node command. Here is an example of a red circle with A label:
 \documentclass[border=0.2cm]{standalone}

% Required package
\usepackage{tikz}


\begin{document}

\begin{tikzpicture}

% Circle with label
\node[draw,
	circle,
	minimum size =2cm,
	fill=red!50,
	label=$A$] (circle1) at (0,0){};

\end{tikzpicture}

\end{document}
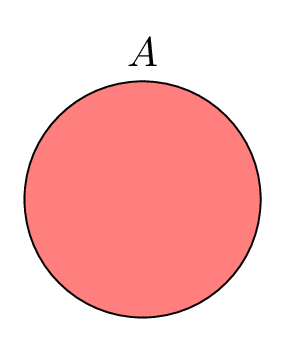
The label is positioned at the top of the circle. To change it, we can specify of the label angle with respect to the horizontal line passing through the node center. Here is an example of two circles with different positioning labels:
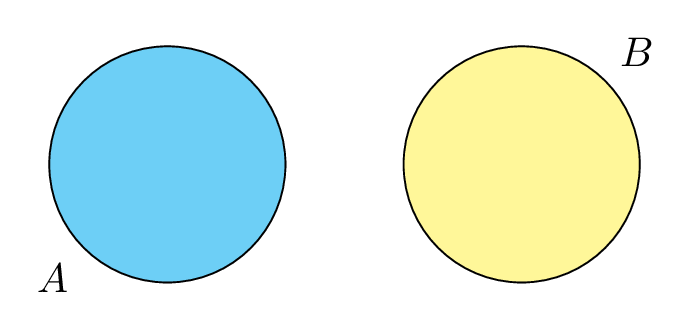
 \documentclass[border=0.2cm]{standalone}

% Required package
\usepackage{tikz}


\begin{document}

\begin{tikzpicture}

% Circle with label at 225 deg.
\node[draw,
	circle,
	minimum size =2cm,
	fill=cyan!50,
	label={225:$A$}] (circle1) at (0,0){};

% Circle with label at 45 deg.
\node[draw,
	circle,
	minimum size =2cm,
	fill=yellow!50,
	label={45:$B$}] (circle2) at (3,0){};

\end{tikzpicture}

\end{document}
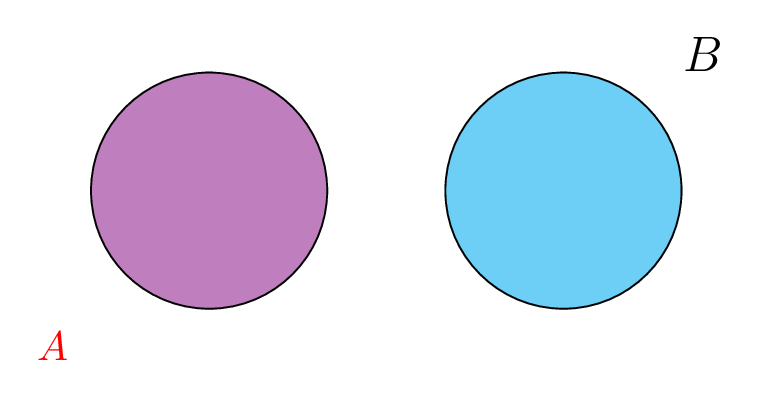
The next changes the label distance as well as the font color and size:
 \documentclass[border=0.2cm]{standalone}

% Required package
\usepackage{tikz}


\begin{document}

\begin{tikzpicture}

% Circle with label distance 0.5cm
\node[draw,
	circle,
	minimum size =2cm,
	fill=violet!50,
	label={[label distance=0.5cm,red]225:$A$}] (circle1) at (0,0){};

% Circle with large label font
\node[draw,
	circle,
	minimum size =2cm,
	fill=cyan!50,
	label={[label distance=0.25cm,font=\large]45:$B$}] (circle2) at (3,0){};

\end{tikzpicture}

\end{document}
Simple Venn diagram
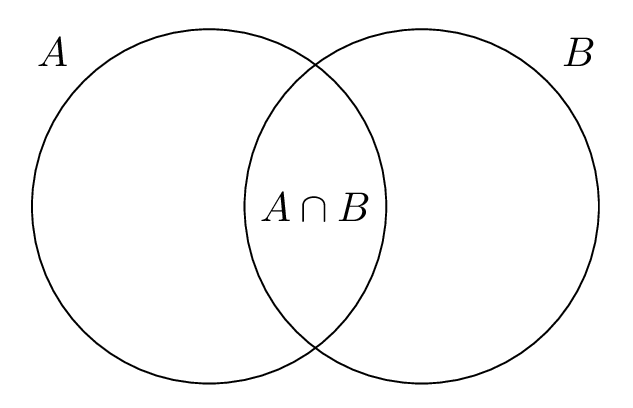
The next LaTeX code highlights the intersection of two sets A and B and adds a text node at the half distance between the two nodes centers:
 \documentclass[border=0.2cm]{standalone}

% Required package
\usepackage{tikz}


\begin{document}

\begin{tikzpicture}

% Set A
\node [draw,
	circle,
	minimum size =3cm,
	label={135:$A$}] (A) at (0,0){};

% Set B
\node [draw,
	circle,
	minimum size =3cm,
	label={45:$B$}] (B) at (1.8,0){};

% Set intersection label
\node at (0.9,0) {$A\cap B$};

\end{tikzpicture}

\end{document}
LaTeX Venn diagram: Union of two sets
The next LaTeX code draws two circles filled with orange color. The circle on the top will hide the border of the bottom circle. For that, the border of the two sets' circles have to be drawn separately with respect to the filled circles. Here is an illustrative example with thick white borders:
 \documentclass[border=0.2cm]{standalone}

% Required package
\usepackage{tikz}


\begin{document}

\begin{tikzpicture}

% Set A
\node [circle,
	fill=orange,
	minimum size =3cm,
	label={135:$A$}] (A) at (0,0){};

% Set B
\node [circle,
	fill=orange,
	minimum size =3cm,
	label={45:$B$}] (B) at (1.8,0){};

% Circles outline
\draw[white,thick] (0,0) circle(1.5cm);
\draw[white,thick] (1.8,0) circle(1.5cm);

% Union text label
\node[orange!90!black] at (0.9,1.8) {$A\cup B$};

\end{tikzpicture}

\end{document}
Compiling the code yields:
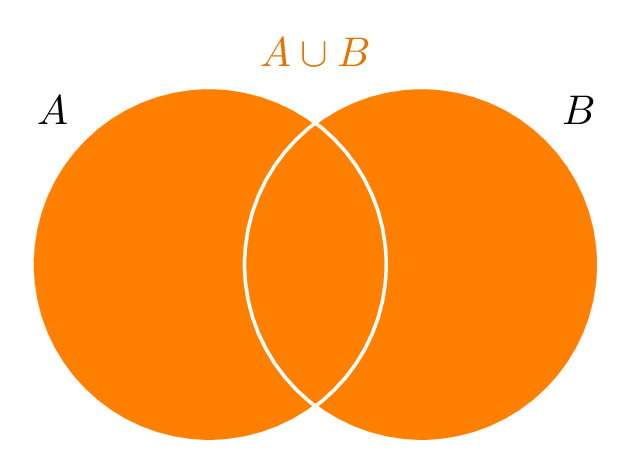
Simplify the code with style option
The previous LaTeX code can be simplified by regrouping different options using style command. This corresponds to the options: circle, fill=orange, minimum size=3cm. The style is named set in the next code:
 \documentclass[border=0.2cm]{standalone}

% Required package
\usepackage[dvipsnames]{xcolor}
\usepackage{tikz}


\begin{document}

\begin{tikzpicture}[thick,
	set/.style = {circle,
		fill=orange,
		minimum size =3cm
	}]

% Set A
\node [set,
	label={135:$A$}] (A) at (0,0){};

% Set B
\node [set,
	label={45:$B$}] (B) at (1.8,0){};

% Circles outline
\draw[white] (0,0) circle(1.5cm);
\draw[white] (1.8,0) circle(1.5cm);

% Union text label
\node[orange!90!black] at (0.9,1.8) {$A\cup B$};

\end{tikzpicture}

\end{document}
LaTeX Venn diagram: Difference of two sets
The next illustration shows the LaTeX Venn diagram of the difference of Two sets A and B. The question now is how to highlight the difference result?
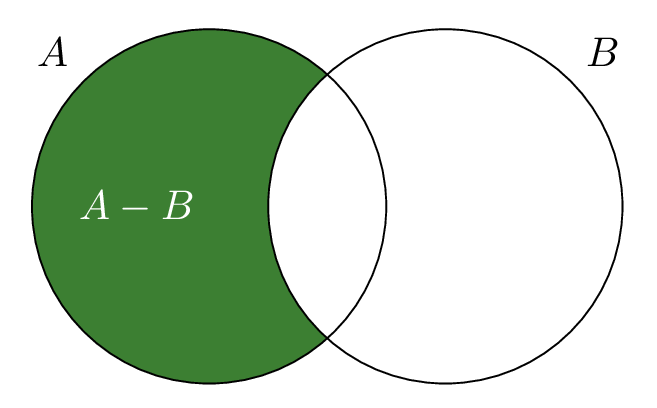
The difference can be easily highlighted by: 1) filling the A set with the green color, 2) filling the B set with white color and 3) draw borders and add A-B label. These three steps are shown in the next illustration:
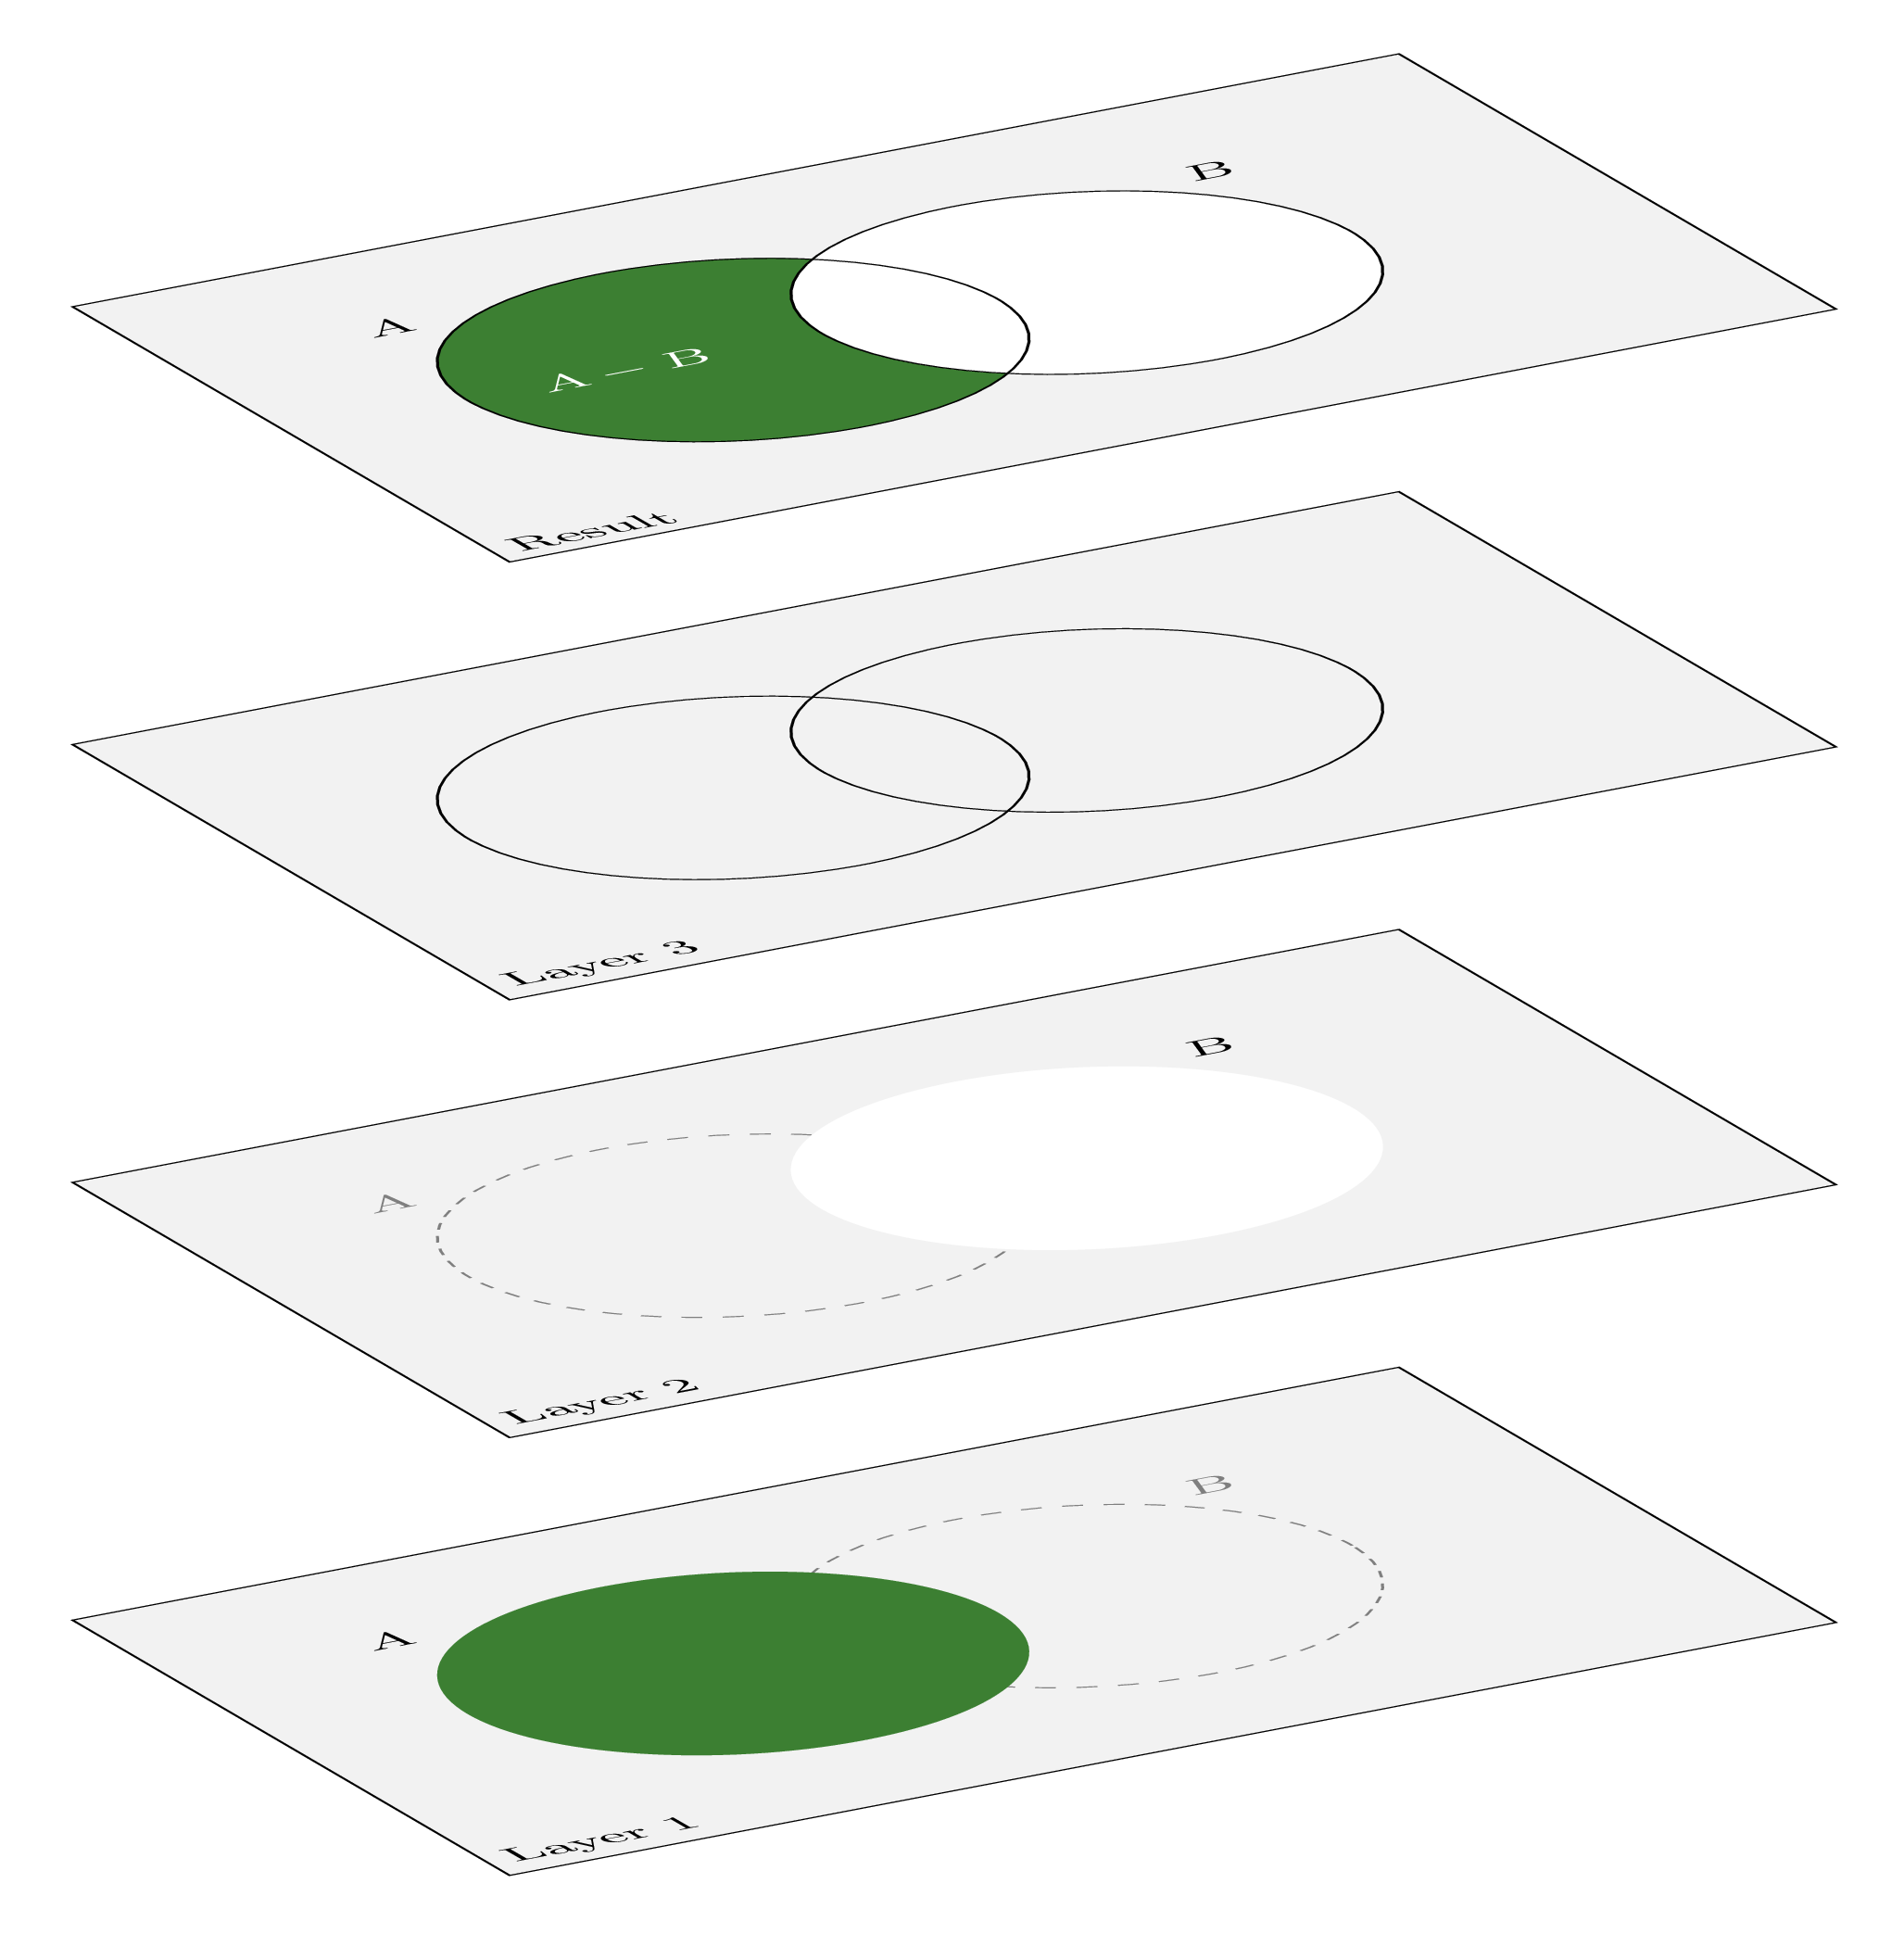
Here is the corresponding LaTeX code of the Venn diagram of the difference of two sets (A-B):
 \documentclass[border=0.2cm]{standalone}

% Required package
\usepackage[dvipsnames]{xcolor}
\usepackage{tikz}


\begin{document}

\begin{tikzpicture}[thick,
	set/.style = { circle, minimum size = 3cm}]

% Set A
\node[set,fill=OliveGreen,label={135:$A$}] (A) at (0,0) {};

% Set B
\node[set,fill=white,label={45:$B$}] (B) at (0:2) {};

% Circles outline
\draw (0,0) circle(1.5cm);
\draw (2,0) circle(1.5cm);

% Difference text label
\node[left,white] at (A.center){$A-B$};

\end{tikzpicture}

\end{document}
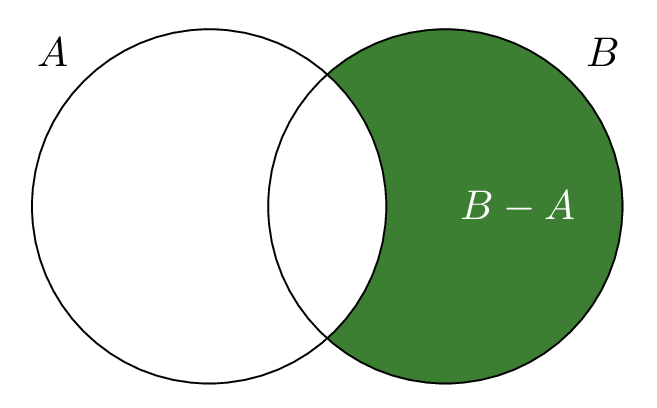
With the same manner as A-B we can highlight the difference B-A:
 \documentclass[border=0.2cm]{standalone}

% Required package
\usepackage[dvipsnames]{xcolor}
\usepackage{tikz}


\begin{document}

\begin{tikzpicture}[thick,
	set/.style = { circle, minimum size = 3cm}]

% Set B
\node[set,fill=OliveGreen,label={45:$B$}] (B) at (0:2) {};

% Set A
\node[set,fill=white,label={135:$A$}] (A) at (0,0) {};

% Circles outline
\draw (0,0) circle(1.5cm);
\draw (2,0) circle(1.5cm);

% Difference text label
\node[right,white] at (B.center){$B-A$};

\end{tikzpicture}

\end{document}
LaTeX Venn diagram: Intersection of two sets
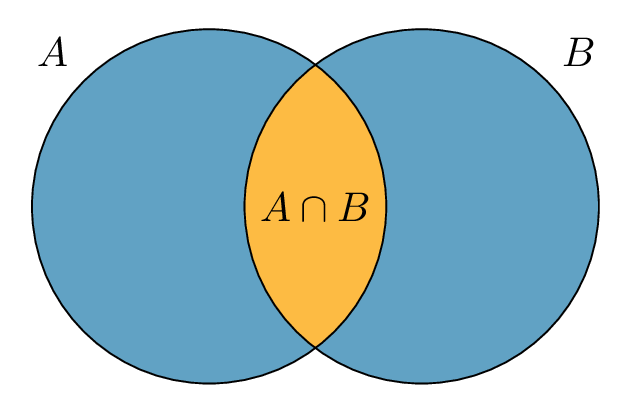
Let's reconsider the above code of the simple Venn diagram. The two circles have to be firstly created and filled with a given color then we fill the intersection region between the two circles. The latter can be achieved by using clip command inside a scope environment. Here is an illustrative example:
 \documentclass[border=0.2cm]{standalone}

% Required packages
\usepackage[dvipsnames]{xcolor}
\usepackage{tikz}


\begin{document}

\begin{tikzpicture}[thick,
	set/.style = {circle,
		minimum size = 3cm,
		fill=MidnightBlue!50}]

% Set A
\node[set,label={135:$A$}] (A) at (0,0) {};

% Set B
\node[set,label={45:$B$}] (B) at (1.8,0) {};

% Intersection
\begin{scope}
	\clip (0,0) circle(1.5cm);
	\clip (1.8,0) circle(1.5cm);
	\fill[Dandelion](0,0) circle(1.5cm);
\end{scope}

% Circles outline
\draw (0,0) circle(1.5cm);
\draw (1.8,0) circle(1.5cm);

% Set intersection label
\node at (0.9,0) {$A\cap B$};

\end{tikzpicture}

\end{document}
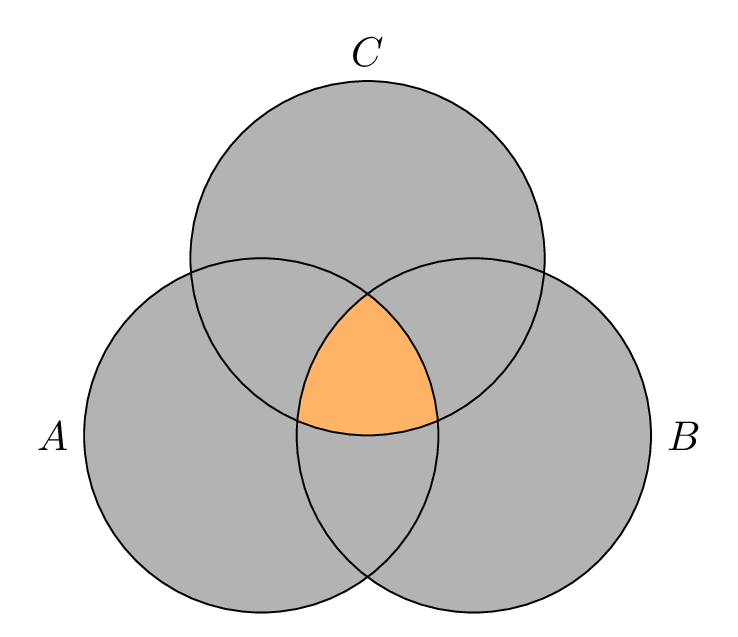
We used \clip command inside a scope environment to get a local effect of the clipping. All drawings inside the scope environment will be clipped to the closed path created by \clip command. We used \clip twice to consider only the intersection region between the two circles.
For more practice, Let's consider the case of three sets!
LaTeX Venn diagram: Intersection of three sets
We have three circles with labels A, B and C. Circles are filled with gray color and the intersection region between them is filled with orange color which can be achieved by using the clip command one time for each circle. Check the code below!
 \documentclass[border=0.2cm]{standalone}

% Required packages
\usepackage[dvipsnames]{xcolor}
\usepackage{tikz}


\begin{document}

\begin{tikzpicture}[thick,
	set/.style = {circle,
		minimum size = 3cm,
		fill=black!30}]

% Set A
\node[set,label={135:$A$}] (A) at (0,0) {};

% Set B
\node[set,label={45:$B$}] (B) at (1.8,0) {};

% Set C
\node[set,label=$C$] (C) at (0.9,1.5) {};

% Intersection
\begin{scope}
	\clip (0,0) circle(1.5cm);
	\clip (1.8,0) circle(1.5cm);
	\clip (0.9,1.5) circle(1.5cm);
	\fill[orange!60](0,0) circle(1.5cm);
\end{scope}

% Circles outline
\draw (0,0) circle(1.5cm);
\draw (1.8,0) circle(1.5cm);
\draw (0.9,1.5) circle(1.5cm);

\end{tikzpicture}

\end{document}
Barycentric coordinate system in TikZ
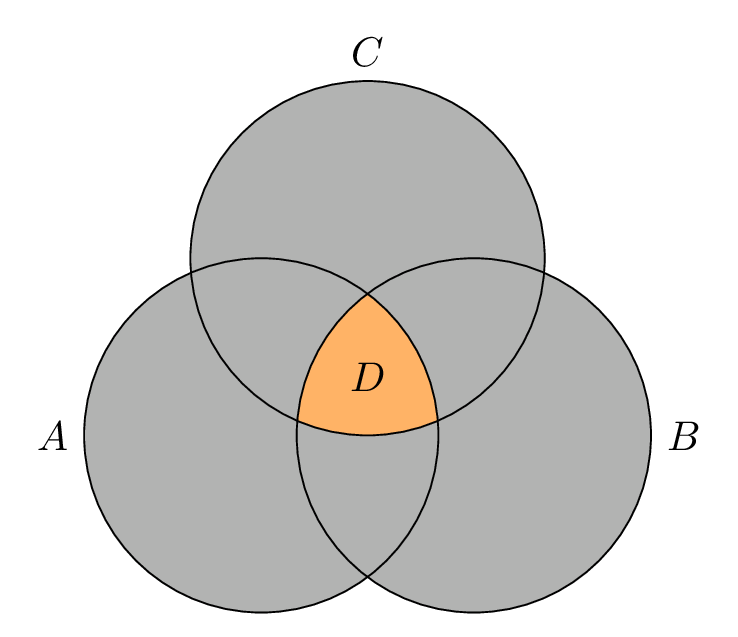
To get the coordinate of the triangle circumcenter formed by the centers of the three circles, we can use the barycentric coordinate system provided by TikZ as follows:
\node at (barycentric cs:A=1,B=1 ,C=1) {$D$};Adding the above line code to the previous TikZ code, we get the following result:
LaTeX Venn diagram: transparency effect
With the same manner, we create a styling for the circles representing our sets: they have a radius of 6 cm, and they have a transparent filling, which enables intersections to have beautiful, mixed colors. We use opaque text to make it easier to read.
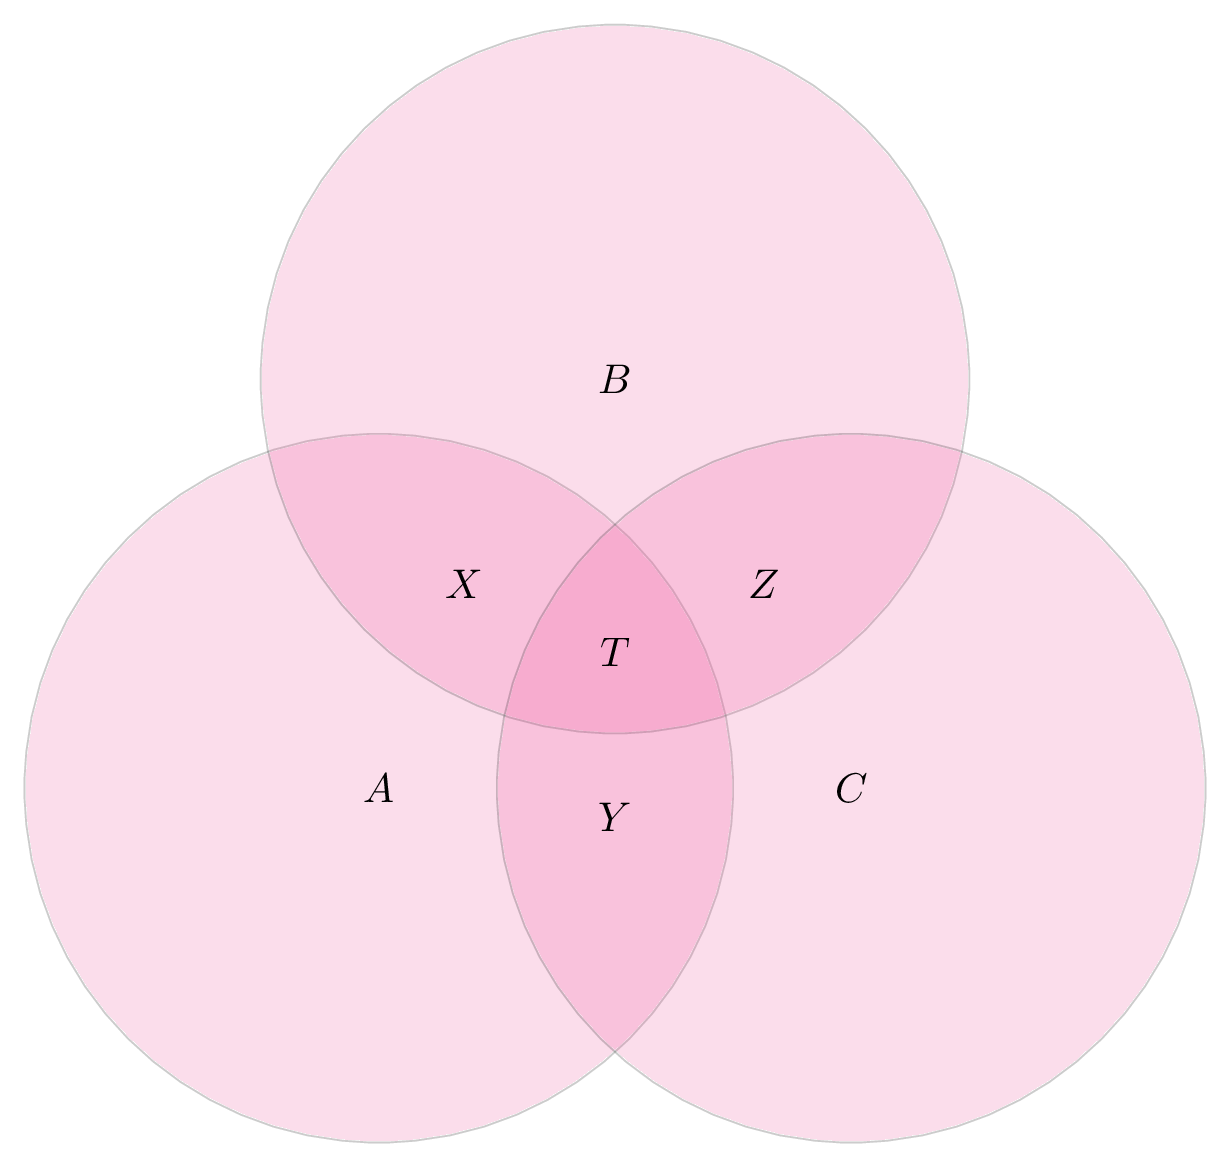
We set the center distance at 4 cm to have enough space for the intersections. We first positioned set A, then placed set B at an angle of 60 degrees with respect to A, and set C next to A.
To add labels to different regions, we used barycentric function which calculates the weighted average of our sets' coordinates. If we use the same weight for all the sets, it will produce the midpoint, which we can use for writing into intersection area.
Here is the corresponding LaTeX code:
 \documentclass[border=0.2cm]{standalone}

% Required packages
\usepackage[dvipsnames]{xcolor}
\usepackage{tikz}


\begin{document}

\begin{tikzpicture} [set/.style = {draw,
	circle,
	minimum size = 6cm,
	fill=Rhodamine,
	opacity = 0.4,
	text opacity = 1}]

\node (A) [set] {$A$};
\node (B) at (60:4cm) [set] {$B$};
\node (C) at (0:4cm) [set] {$C$};

\node at (barycentric cs:A=1,B=1) [left] {$X$};
\node at (barycentric cs:A=1,C=1) [below] {$Y$};
\node at (barycentric cs:B=1,C=1) [right] {$Z$};
\node at (barycentric cs:A=1,B=1,C=1) [] {$T$};

\end{tikzpicture}

\end{document}
LaTeX Venn diagram Four ellipses
It corresponds to four ellipses with different rotations and shifting. Drawing an ellipse in LaTeX can be done using draw command and ellipse operation as follows:
\draw (x,y) ellipse (Xr and Yr);
where Xr and Yr are x-radius and y-radius of the ellipse. Here is an example of Four Ellipses Venn Diagram in LaTeX:
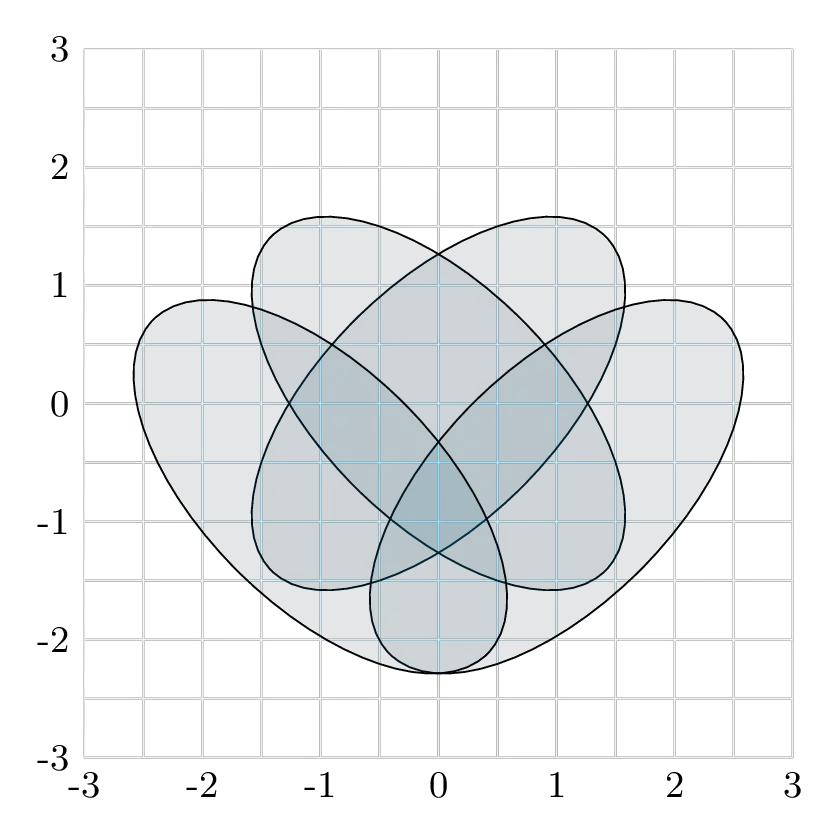
and the corresponding code:
 \documentclass[border=0.2cm]{standalone}

% Required packages
\usepackage{tikz}


\begin{document}

\begin{tikzpicture}[set/.style={fill=cyan,fill opacity=0.1}]

% Help grid
\draw[black!5,step=0.5] (-3,-3) grid (3,3);
\foreach \i in {-3,-2,...,3}
{
	\node[below] at (\i,-3){\small \i};
	\node[left] at (-3,\i){\small \i};
}

% Ellipse 1
\draw[set,
	rotate =45] (0,0) ellipse (2cm and 1cm);

% Ellipse 2
\draw[set,
	rotate =-45] (0,0) ellipse (2cm and 1cm);

% Ellipse 3
\draw[set,
	xshift=1cm,
	yshift=-0.705cm,
	rotate =45] (0,0) ellipse (2cm and 1cm);

% Ellipse 4
\draw[set,
	xshift=-1cm,
	yshift=-0.705cm,
	rotate =-45,] (0,0) ellipse (2cm and 1cm);

\end{tikzpicture}

\end{document}

Hello,
I think that in the code of your “diagram: transparency effect” a comma is missing.
row 13: fill=Rhodamine,
Thanks for the good TikZ-explanations.
Hello Michael,
Many Thanks for your encouraging feedback, I really appreciate!
Correct, there should be a comma after Rhodamine option. Sometimes, when I organize the code by moving different options around, I make mistakes like this one 🙂.
Thanks again!