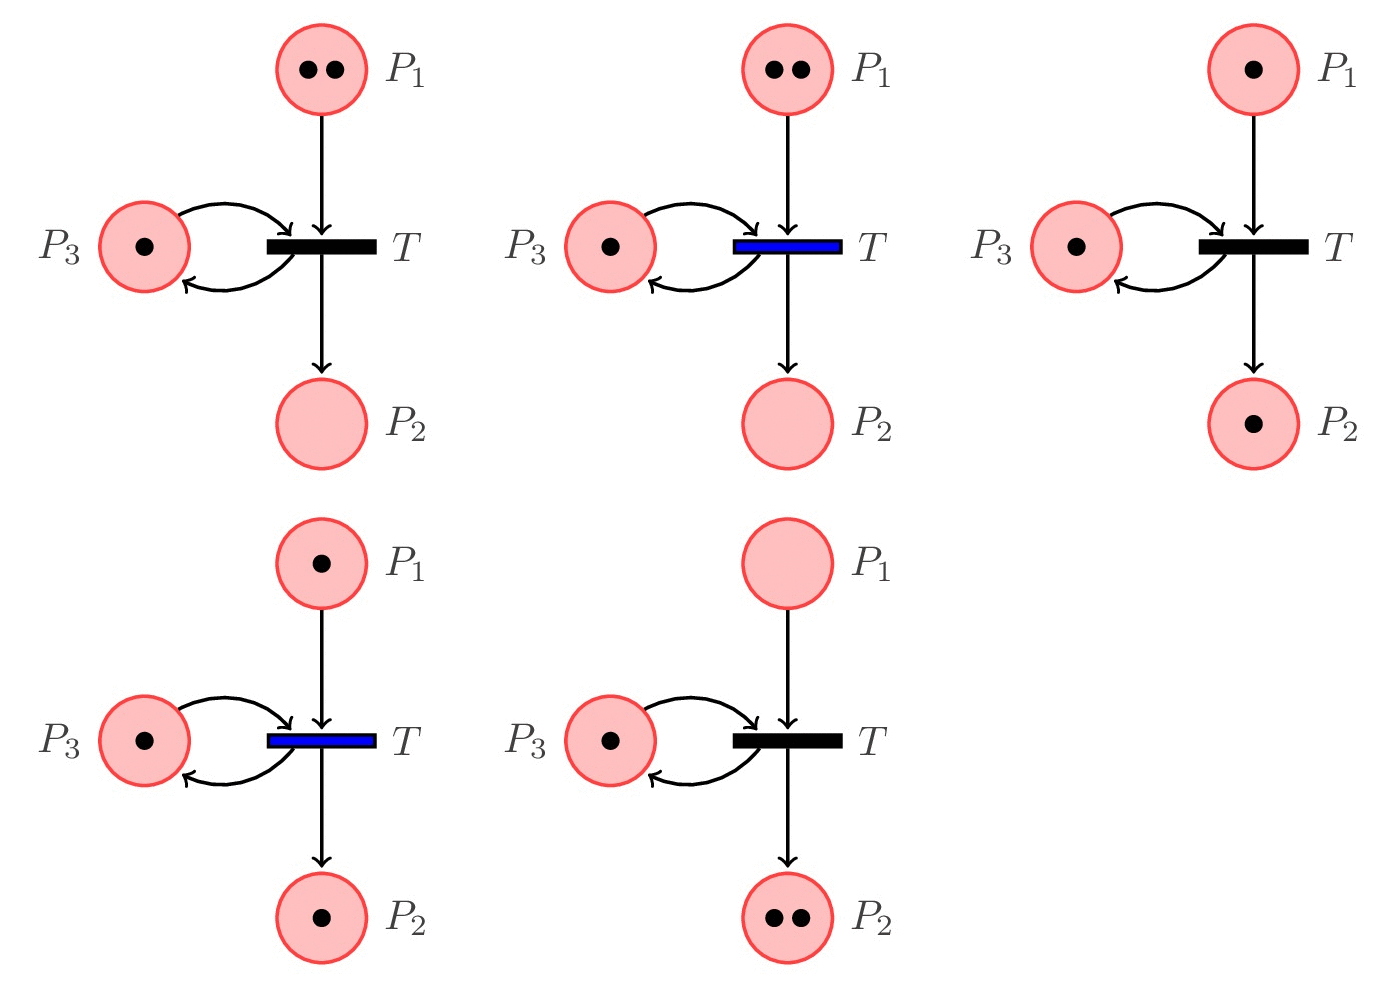
Drawing Petri Nets in TikZ: Quick guide
1. Required packages and libraries
We need to load the following in the document preamble:
1. TikZ: this is the package that brings you to this tutorial, it is required to start your drawing journey in LaTeX
2. petri: this corresponds to a TikZ library which makes drawing Petri Nets in TikZ easier.
3. positioning: this TikZ library allows us to use relative positioning of places and transitions.
Here is the LaTeX code with the TikZpicture environment:
 \documentclass[border = 0.2cm]{standalone}

% Required packages and libraries
\usepackage{tikz}
\usetikzlibrary{petri,positioning}

\begin{document}

\begin{tikzpicture}
	% Petri Net illustration Code
\end{tikzpicture}

\end{document}
2. Draw places in TikZ
The petri library allows us to draw places by providing the option place to the node command. Here is an illustrative example:
% Place
\node[place] (place1) at (0,0) {};
In fact, a place corresponds to a predefined circle node provided by the petri library. This means that customizing the place corresponds to customizing a circle node shape. To this end, I invite you to check this tutorial: TikZ shapes: circle.
- How to add labels?
As mentioned above, what applies to circle node shape applies also to the place. Check the following example:
% Place 1
\node[place,
	label=left:$P_1$] (place1) at (0,0) {};

% Place 2
\node[place,
	label=above:$P_2$,
	label=right:$P_2$,
	label=left:$P_2$,
	label=below:$P_2$] (place2) at (2,0) {};

% Place 3
\node[place,
	label=0:$P_3$] (place3) at (4,0) {};
which yields the following result:
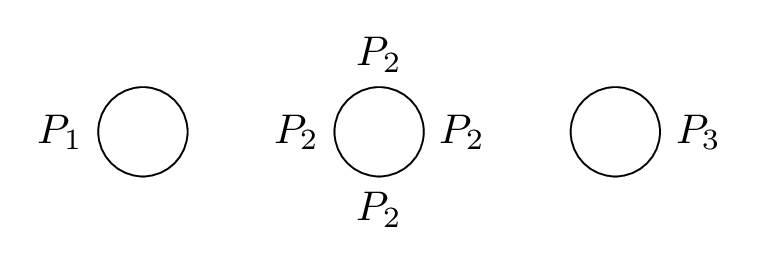
- We have created three places named (place1), (place2) and (place3) positioned at the points with coordinates (0,0), (2,0) and (4,0), respectively.
- We can add labels to places by proving the option label to the node command. label={above:$P_2$} will place the label $P_2$ above the place.
- We can also add multiple labels by adding more label option to the node command. This corresponds to the middle place.
- We can use angles to position labels and this can be achieved as follows: label={angle:LabelName}. Check the third place in the above example!
- How to add tokens to places?
Adding tokens to places is easy as providing the option tokens=<value> to the node command. Here is an example:
% Place 1
\node[place,
	label={135:$P_1$}] (place1) at (0,0) {};

% Place 2
\node[place,
	label={45:$P_2$},
	tokens=3] (place2) at (2,0) {};
which yields the following result:
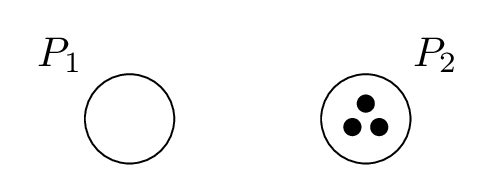
- We have created two places: one without tokens and one with three tokens.
- We have added labels at 135 degrees and at 45 degrees for place 1 and for place 2, respectively.
- How to modify the color of places?
Modifying the color of places or transitions can be done by providing the filling color using the option fill=<color> and/or the drawing color by using the option draw=<color>. Here is an example:
% Place 1
\node[place,
	fill=red!25,
	draw=red!75,
	tokens=2,
	label=$P_1$] (place1) at (0,0) {};

% Place 2
\node[place,
	fill=teal!25,
	draw=teal!75,
	tokens=1,
	label=$P_2$] (place2) at (2,0) {};

% Place 3
\node[place,
	fill=blue!25,
	draw=blue!75,
	tokens=5,
	label=$P_3$] (place3) at (4,0) {};

Let's move now to drawing transitions in TikZ!
3. Draw transitions in TikZ
A transition in Petri Nets is represented by a rectangle. In TikZ, this can be achieved by using a rectangle node shape or simply we can use transition option provided by the petri library. Here is an example:
% Place 1
\node[place,
	tokens=1,
	label=$P_1$] (place1) at (0,0) {};


% Place 2
\node[place,
	tokens=2,
	label=$P_2$] (place2) at (4,0) {};

% Transition
\node[transition,
	label=$T$] (Trans) at (2,0) {};
which yields the following illustration:

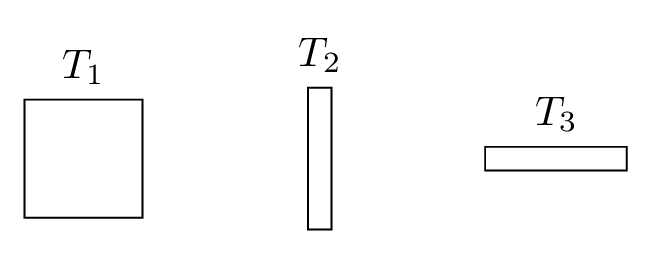
- How to change width and height of the transition?
The size of the transition can be changed by providing the options: minimum size=<value>, minimum height=<value>, minimum width=<value> to the node command in question. Here is an illustrative example:
% Transition 1
\node[transition,
	minimum size=1cm,
	label=$T_1$] (Trans1) at (0,0) {};

% Transition 2
\node[transition,
	minimum width=2mm,
	minimum height=12mm,
	label=$T_2$] (Trans2) at (2,0) {};

% Transition 3
\node[transition,
	minimum width=12mm,
	minimum height=2mm,
	label=$T_3$] (Trans3) at (4,0) {};
- How to change the color of a transition?
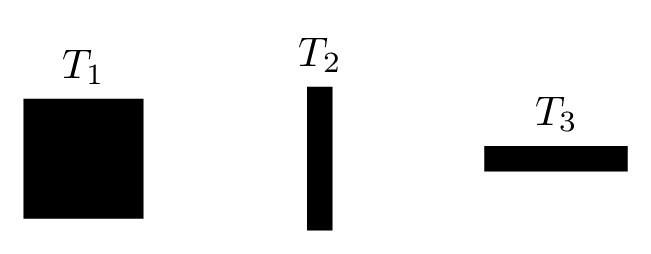
This can be achieved with the same manner as we did with places. The next illustration is obtained by adding the option fill=black to the node command.
4. Connect places with transitions
Connecting places to transitions or transitions to places is achieved by directed lines. We will present two methods:
- Using standard method
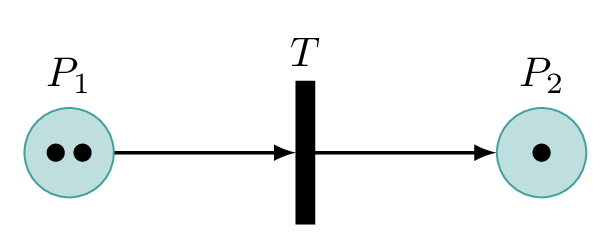
The following code shows an example of two places and one transition connected using directed straight lines. The arrowhead style corresponds to latex, check the post: TikZ arrows for more styles.
\documentclass[border = 0.2cm]{standalone}

% Required packages and libraries
\usepackage{tikz}
\usetikzlibrary{positioning,petri}

\begin{document}

\begin{tikzpicture}

% Place 1
\node[place,
	fill=teal!25,
	draw=teal!75,
	tokens=2,
	label=$P_1$] (place1) at (0,0) {};

% Place 2
\node[place,
	fill=teal!25,
	draw=teal!75,
	tokens=1,
	label=$P_2$] (place2) at (4,0) {};

% Transition
\node[transition,
	minimum height=12mm,
	minimum width=1.5mm,
	fill=black,
	label=$T$] (trans) at (2,0) {};

% Connect P-T
\draw[-latex,thick] (place1) -- (trans);

% Connect T-P
\draw[-latex,thick] (trans) -- (place2);

\end{tikzpicture}

\end{document}
Compiling the above code yields the following TikZ illustration:
- Using Petri library
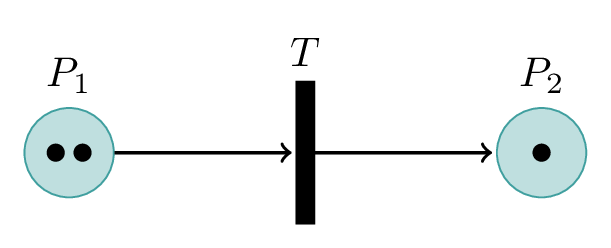
Petri library provides two options: post and pre which can be used with edge operation to draw directed lines. post corresponds to -ArrowHeadName, pre corresponds to ArrowHeadName- options. Here is the corresponding code:
% Connect P-T-P
\draw[thick] (place1) edge[post] (trans)
	(trans) edge[post] (place2);
and the corresponding illustration:
5. Relative positioning in TikZ
We used absolute positioning for places and transitions in the previous illustrative examples. TikZ provides the option to use relative positioning, which means we can create places and transitions relatively to other elements, using keywords such as below, above, right and left.
Here is an illustrative example:
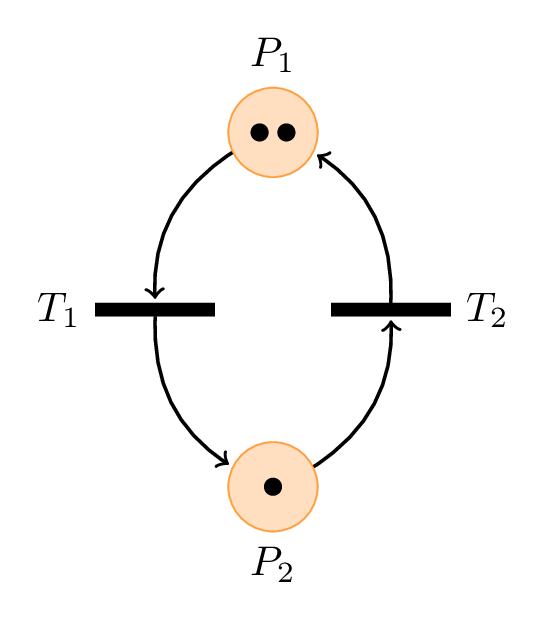
and the corresponding code:
\documentclass[border = 0.2cm]{standalone}

% Required packages and libraries
\usepackage{tikz}
\usetikzlibrary{positioning,petri}

\begin{document}

\begin{tikzpicture}[node distance=3cm,on grid]

% Place 1
\node[place,
	fill=orange!25,
	draw=orange!75,
	tokens=2,
	label=$P_1$] (place1) {};

% Place 2
\node[place,
	below=of place1,
	fill=orange!25,
	draw=orange!75,
	tokens=1,
	label=below:$P_2$] (place2) {};

% Transition 1
\node[transition,
	below left= 1.5cm and 1cm of place1,
	minimum height=1mm,
	minimum width=10mm,
	fill=black,
	label=left:$T_1$] (trans1) {};

% Transition 2
\node[transition,
	below right= 1.5cm and 1cm of place1,
	minimum height=1mm,
	minimum width=10mm,
	fill=black,
	label=right:$T_2$] (trans2) {};

% Connect P1-T1-P2-T2-P1
\draw[thick] (place1) edge[post,bend right=30] (trans1)
	(trans1) edge[post,bend right=30] (place2)
	(place2) edge[post,bend right=30] (trans2)
	(trans2) edge[post,bend right=30] (place1);

\end{tikzpicture}

\end{document}
Comments:
- We have created place 2 using relative positioning. It's placed below place 1 along the vertical axis. This is achieved by the option below= of place1.
- The node distance is set to 3cm which is the distance between the two places' centers (set by the option on grid).
- Transitions are placed at below left and below right of place 1. It is positioned 1.5cm far from place 1 along the y-axis and 1cm far from place 1 along the x-axis. This is achieved by the option below left=1.5cm and 1cm of place1.
- We have used curved lines to connect transitions with places. This is achieved using bend left or bend right options. We have specified the bending angle using bend right=30.
6. Change styling of places, transitions, labels, and tokens
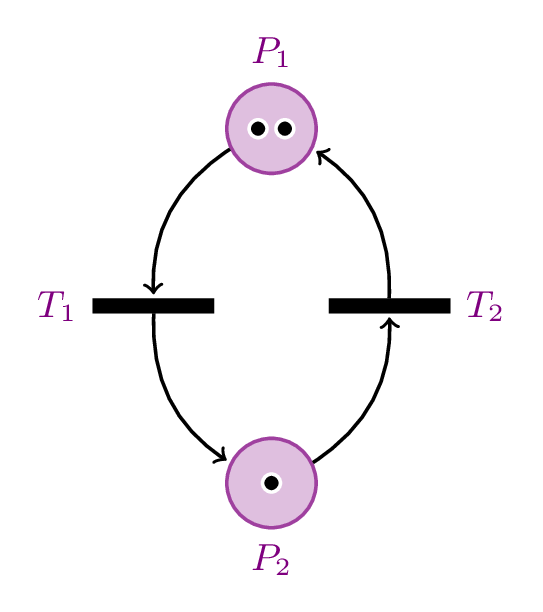
It happens that the Petri net that we would like to draw has many places and transitions. To optimize the code, we can create a general style for places, transitions, labels and tokens. The next code is the same as the previous one with a different color choice and global styling:
\documentclass[border = 0.2cm]{standalone}

% Required packages and libraries
\usepackage{tikz}
\usetikzlibrary{positioning,petri}

\begin{document}

\begin{tikzpicture}[thick,
	node distance=3cm,
	on grid,
	every transition/.style={
		fill=black,
		minimum width=10mm,
		minimum height=1mm
	},
	every place/.style={
		fill=violet!25,
		draw=violet!75
	},
	every label/.style={
		violet,
		font=\small
	},
	every token/.style={
		draw=white,
		fill=black
	}
]

% Place 1
\node[place,
	tokens=2,
	label=$P_1$] (place1) {};

% Place 2
\node[place,
	below=of place1,
	tokens=1,
	label=below:$P_2$] (place2) {};

% Transition 1
\node[transition,
	below left= 1.5cm and 1cm of place1,
	label=left:$T_1$] (trans1) {};

% Transition 2
\node[transition,
	below right= 1.5cm and 1cm of place1,
	label=right:$T_2$] (trans2) {};

% Connect P1-T1-P2-T2-P1
\draw (place1) edge[post,bend right=30] (trans1)
	(trans1) edge[post,bend right=30] (place2)
	(place2) edge[post,bend right=30] (trans2)
	(trans2) edge[post,bend right=30] (place1);
\end{tikzpicture}

\end{document}
which yields to the following TikZ illustration:
- Change arrows style
With the same manner, we can choose the style of pre and post of arrowheads style and small space between the arrowhead and the border of the element connected to it. The following styles should be provided to the tikzpicture environment through brackets as above:
[
	pre/.style={
		<-,
		shorten <=1pt,
		>={stealth}
	},
	post/.style={
		->,
		shorten >=1pt,
		>={stealth}
	},
]
For more arrowhead styles, we can load arrows.meta library, check this post "TikZ arrows" for a complete list.
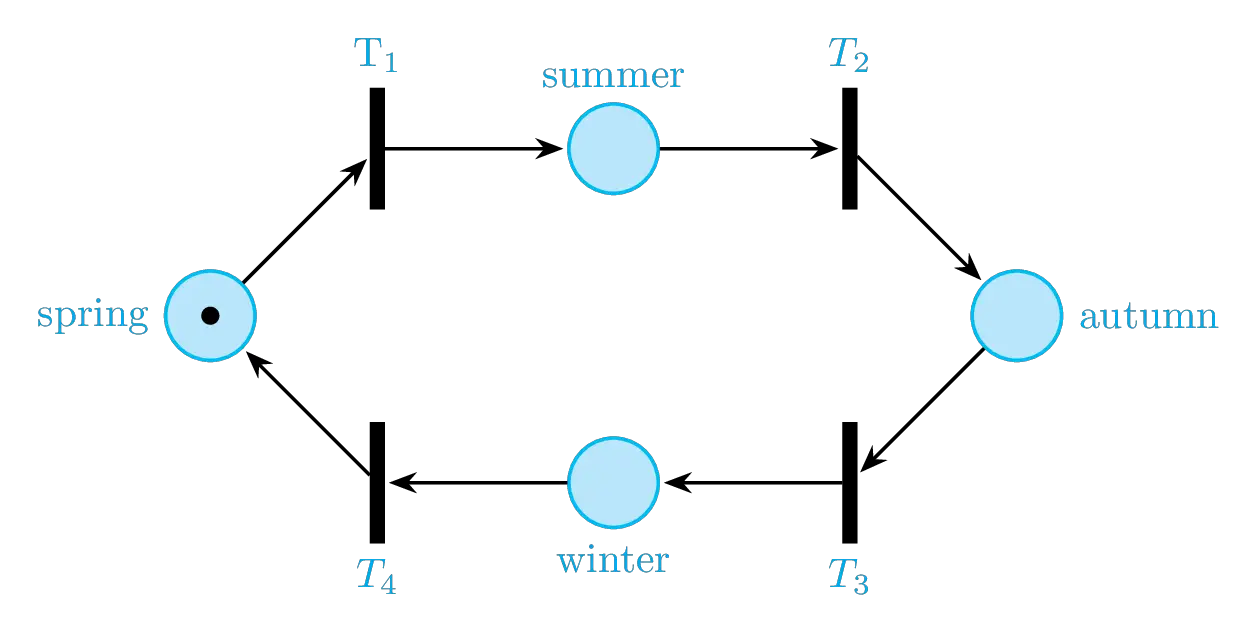
Example 1: Four seasons Petri Net in TikZ
It consists of four places and four transitions, check it's code below!
\documentclass[border = 0.2cm]{standalone}
\usepackage{tikz}

\usetikzlibrary{positioning,petri,arrows.meta}

\begin{document}

\begin{tikzpicture}[
% Change style
	thick,
	node distance=2cm,
	on grid,
	pre/.style={<-, shorten <=1pt, >={Stealth}},
	post/.style={->,shorten >=1pt, >={Stealth}},
	every transition/.style={fill,minimum width=1mm, minimum height=10mm},
	every place/.style={fill=cyan!25,draw=cyan!75},
	every label/.style={cyan}]

% Place 1
\node[place,tokens=1,
	label=left:spring] (place1) {};

% Transition 1
\node[transition, above right= of place1,
	label=above:T$_1$] (trans1) {};

% Transition 4
\node[transition,below right= of place1,
	label=below:$T_4$] (trans4) {};

% Place 2
\node[place,right=of trans1,
	label=above:summer] (place2) {};

% Transition 2
\node[transition,right= of place2,
	label=above:$T_2$] (trans2) {};

% Place 3
\node[place,below right=of trans2,
	label=right:autumn] (place3) {};

% Place 4
\node[place,right=of trans4,
	label=below:winter] (place4) {};

% Transition 3
\node[transition,right= of place4,
	label=below:$T_3$] (trans3) {};

% Connections
\draw (place1) edge[post] (trans1)
	(trans1) edge[post] (place2)
	(place2) edge[post] (trans2)
	(trans2) edge[post] (place3)
	(place3) edge[post] (trans3)
	(trans3) edge[post] (place4)
	(place4) edge[post] (trans4)
	(trans4) edge[post] (place1);

\end{tikzpicture}

\end{document}
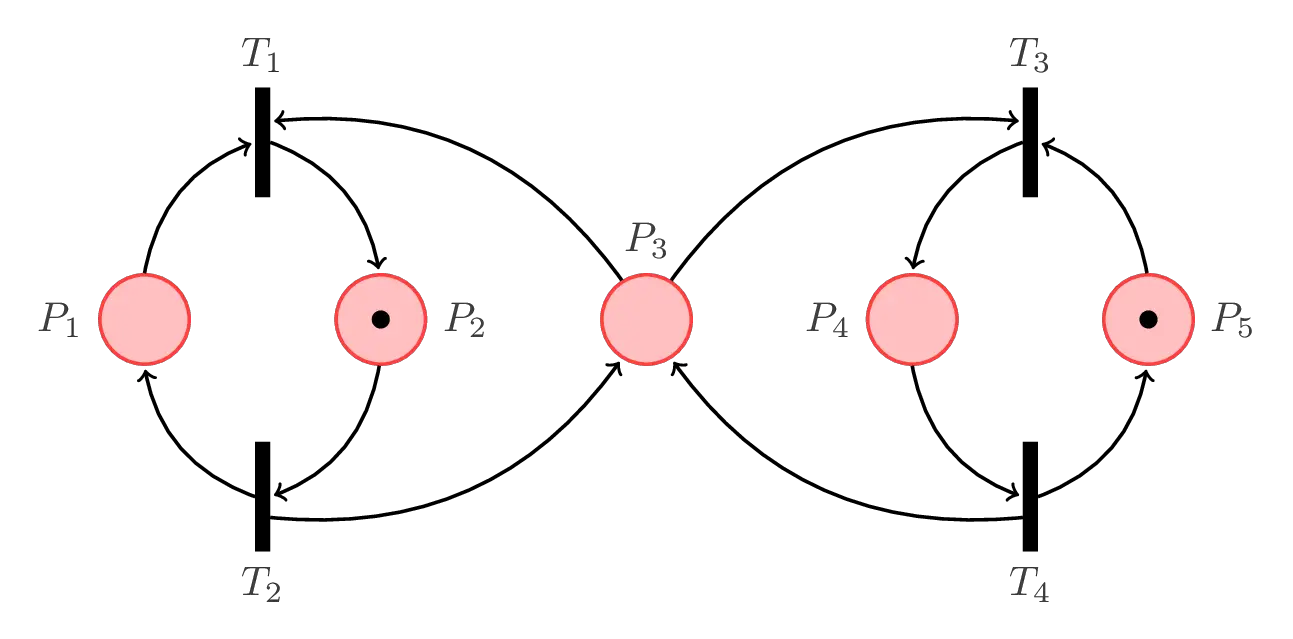
Example 2: TikZ Petri Net of Two concurrent processes with the same resource
\documentclass[border = 0.2cm]{standalone}
\usepackage{tikz}

\usetikzlibrary{decorations.markings,positioning,petri}

\begin{document}

\begin{tikzpicture}[thick,
	node distance=2cm,
	on grid,
	every transition/.style={fill=black,minimum width=.1cm, minimum height=0.9cm},
	every place/.style={fill=red!25,draw=red!75},
	every label/.style={black!75}]

% Places
\node[place,
	label=left:$P_1$] (place1) {};

\node[place,
	right=of place1,
	tokens=1,
	label=right:$P_2$] (place2) {};

\node[place,
	right= 2.25cm of place2,
	label=$P_3$] (place3) {};

\node[place,
	right= 2.25cm of place3,
	label=left:$P_4$] (place4) {};

\node[place,
	right=of place4,
	tokens=1,
	label=right:$P_5$] (place5) {};

% Transitions
\node[transition,
	above left=1.5cm and 1cm of place2,
	label=$T_1$] (T1) {};

\node[transition,
	below left=1.5cm and 1cm of place2,
	label=below:$T_2$] (T2) {};

\node[transition,
	above right=1.5cm and 1cm of place4,
	label=$T_3$] (T3) {};

\node[transition,
	below right=1.5cm and 1cm of place4,
	label=below:$T_4$] (T4) {};

% connections
\draw (T1.east) edge[bend left,post] (place2)
	(place2) edge[bend left,post] (T2.east)
	(T2.west) edge[bend left,post] (place1.south)
	(place1.north) edge[bend left,post] (T1.west);

\draw (T2.-70) edge[bend right,post] (place3)
	(place3)edge[bend right,post] (T1.70);

\draw (T3.east) edge[bend left,pre] (place5)
	(place5) edge[bend left,pre] (T4.east)
	(T4.west) edge[bend left,pre] (place4.south)
	(place4.north) edge[bend left,pre] (T3.west);

\draw (T4.250) edge[bend left,post] (place3)
	(place3)edge[bend left,post] (T3.110) ;

\end{tikzpicture}

\end{document}

Thanks for your tutorial.
I found a spelling mistake:
3. Draw transitions in TikZ
% Place 1
\node[place,
tokens=1,
label=$P_2$] (place1) at (0,0) {};
should be:
% Place 1
\node[place,
tokens=1,
label=$P_1$] (place1) at (0,0) {};
You’re welcome Christian!
Many thanks for your remark, I’ve updated it 😊.