What is a Flowchart?
Common Elements of a Flowchart
There are different types of building blocks representing different elements in a flowchart:
Process Block
It represents an operation that changes system data. It has a rectangular shape.
Decision Block
It is used to show any kind of conditional operation that divides our flow path into two. It has a rhombus (diamond) shape.
Input/Output Block
It indicates the process of reading or writing. It's usually used for external data input or printing data to a display. It is represented as a rhomboid.
Predefined Process Block
It is used for calls made to known, defined processes. It is shown as a rectangle with double-struck vertical edges.
Terminal Block
It represents the beginning and ending of the process. It has a stadium shape, which is roughly a rectangle with curved sides.
So a flowchart basically contains these five types of blocks, connected with arrows to indicate direction of the flow. Although different types of elements can be encountered in flowcharts, most of the time these five block types will be sufficient to describe a process.
Drawing a Flowchart in TikZ
To draw a flowchart, we will need TikZ package and some block shapes and arrows to start with, which we can find in shapes and arrows.meta libraries. We may also need positioning library to easily place our blocks. We will declare them and then create a tikzpicture environment.
 \documentclass{standalone}

% Required package
\usepackage{tikz}
\usetikzlibrary{shapes, arrows.meta, positioning}

\begin{document}

\begin{tikzpicture}
	% We will draw our flowchart here
\end{tikzpicture}

\end{document}
The next step to learn how draw block shapes using node command.
How to draw a rectangle in TikZ?
The process block shape corresponds to a rectangle which is one of the predefined shapes in TikZ (it does not require loading the shapes library). In addition, each created node has a rectangle shape by default. Check the following code:
 \documentclass{standalone}

% Required package
\usepackage{tikz}
\usetikzlibrary{shapes, arrows.meta, positioning}

\begin{document}

\begin{tikzpicture}

% draw rectangle node
	\node[draw,
		minimum width=2cm,
		minimum height=1cm] at (0,0) {Process 1};

% Change line color
	\node[draw=red,
		minimum width=2cm,
		minimum height=1cm] at (3,0) {Process 2};

% Change filling color
	\node[draw,
		fill=cyan!50,
		minimum width=2cm,
		minimum height=1cm] at (0,-2) {Process 2};

% Change text color
	\node[draw,
		text=red,
		minimum width=2cm,
		minimum height=1cm] at (3,-2) {Process 2};

\end{tikzpicture}

\end{document}
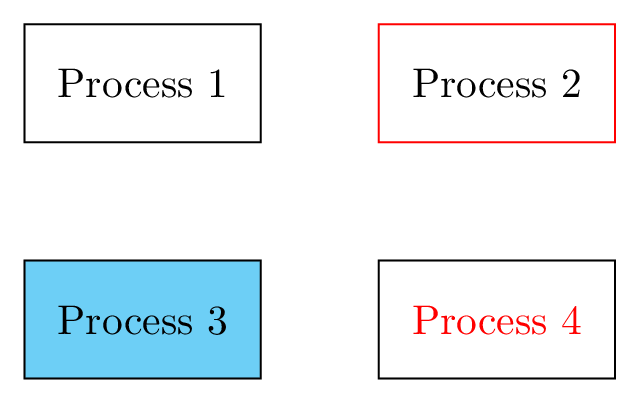
In the above code, we have created a rectangle shape using \node command. These nodes are positioned at different cartesian coordinates (0,0), (3,0), (0,-2) and (3,-2). For each block, we have added different options:
- draw: this options draws the shape of the node. In this case, we didn't specified the node shape and it corresponds to its default one which is a rectangle.
- draw=red: by providing a color name to the draw command will change the line drawing color.
- text=red: by providing a color to the text key, it will change the text color of the node content.
- fill=cyan!50: this option will fills the node shape with a cyan color.
- minimum width=2cm: this option sets the width of the node shape which depends on its content
- minimum height=1cm: sets the minimum height of the node shape.
How to draw a rounded rectangle shape in TikZ?
This shape represents a terminal block of a flowchart which corresponds to a rounded rectangle (pill shape). In TikZ, a rounded rectangle can be drawn with two methods:
- Method 1: standard rectangle with rounded corners option
- Method 2: rounded rectangle shape provided by shapes TikZ library
Check the following code:
\begin{tikzpicture}

% Method 2
\node[draw,
	rounded rectangle,
	minimum width=2.5cm,minimum height=1cm] at (0,0){default};

\node[draw,
	rounded rectangle,
	rounded rectangle arc length=45,
	minimum width=2.5cm,
	minimum height=1cm] at (4,0){arc 45};


\node[draw,
	rounded rectangle,
	rounded rectangle arc length=90,
	minimum width=2.5cm,
	minimum height=1cm] at (0,-2){arc 90};

% Method 1
\node[draw,
	rounded corners=0.5cm,
	minimum width=2.5cm,
	minimum height=1cm,red] at (4,-2){R. corners};

\end{tikzpicture}
Which yields the following TikZ illustration:
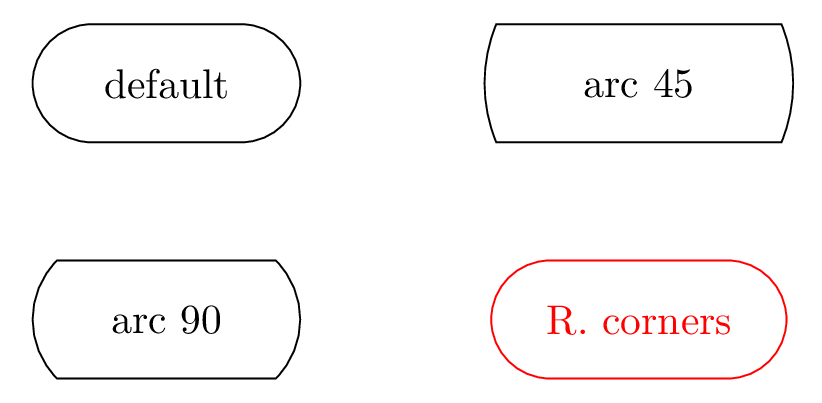
For method 2: adding rounded rectangle to the node option will create a rectangle with circular sides. By default, its rounded rectangle arc length is equal to 180. By changing this option, we will get different arc styles in the rectangle right and left sides (Check the above illustration for the case of 45 and 90).
Method 1: using the option rounded corners, it rounds the corners of the rectangle. To get pill shape the rounded corners option has to be equal to the half height of the rectangle which is equal to 0.5cm in this case.
How to draw a diamond in TikZ?
Decision blocks has a diamond shape which can be drawn easily by providing the diamond option to the node command. We can use the same options mentioned above and moreover, we can specify the aspect ratio of the diamond shape. Here is an example:
 \documentclass{standalone}

% Required package
\usepackage{tikz}
\usetikzlibrary{shapes, arrows, calc, positioning}

\begin{document}

\begin{tikzpicture}


\node[diamond,draw] at (0,0) {Decision};

\node[diamond,draw,aspect=2] at (3,0) {Decision};

\node[diamond,draw,aspect=0.5] at (6,0) {Decision};

\end{tikzpicture}

\end{document}
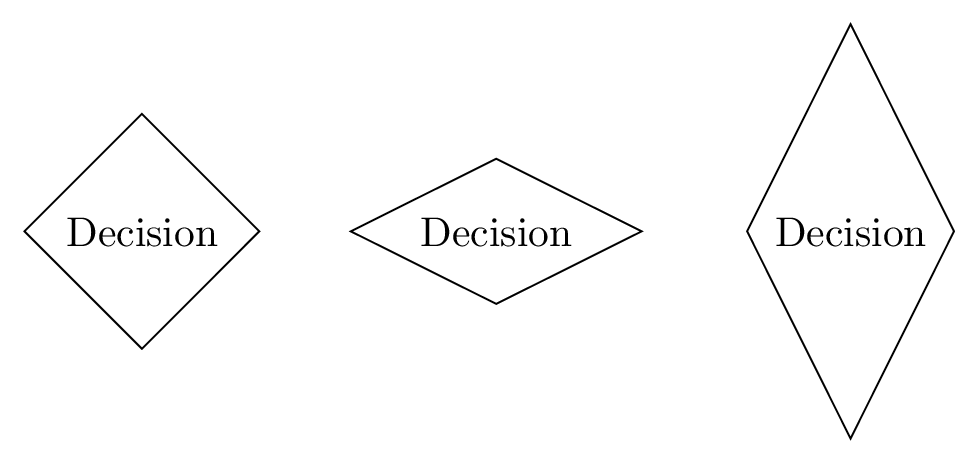
It should be noted that shapes library is required to draw the diamond shape.
How to draw a rhomboid in TikZ?
For input/output block, we can create a rhomboid using the trapezium shape. We need to declare its angles to make sure it isn't any other kind of trapezium, hence we use trapezium left angle = 65 and trapezium right angle = 115 commands.
As a final touch, we will add trapezium stretches option to be able to enlarge the width and height of our rhomboid independently. It will help us particularly with long texts, where we want to increase the width without any dependencies to height. Check the following code for different trapezium shapes:
 \documentclass{standalone}

% Required package
\usepackage{tikz}
\usetikzlibrary{shapes, arrows, calc, positioning}

\begin{document}

\begin{tikzpicture}

\node[draw,
	trapezium,
	trapezium left angle = 65,
	trapezium right angle = 115,
	trapezium stretches] at (0,0) {I/O Block};

\node[draw,
	trapezium,
	trapezium left angle = 120,
	trapezium right angle = 120,
	trapezium stretches] at (3,0) {I/O Block};

\node[draw,
	trapezium,
	trapezium left angle = 90,
	trapezium right angle = 45,
	trapezium stretches] at (6,0) {I/O Block};

\end{tikzpicture}

\end{document}
Compiling this code yields the following TikZ illustration:

Let's continue with the predefined process block!
How to draw a Predefined process shape?
A predefined process shape is shown in the next illustration. To draw it, we need to draw a small rectangle on either side of a standard rectangle. By setting a name to the middle rectangle (e.g. PProcess), we can access to its corners using: (PProcess.north east), (PProcess.south east), (PProcess.south west) and (PProcess.north west). There are more anchors, check this post for more details!
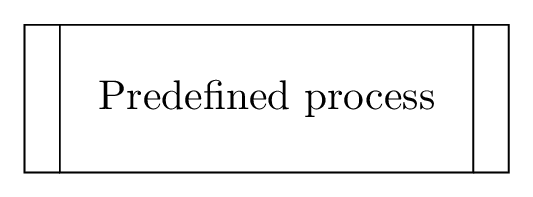
This shape has been generated using the following code:
 \documentclass{standalone}

% Required package
\usepackage{tikz}
\usetikzlibrary{shapes, arrows, calc, positioning}

\begin{document}

\begin{tikzpicture}

% Middle rectangle
\node[draw,
	minimum width=3.5cm,
	minimum height=1.25cm,
	outer sep=0 ] (PProcess) at (0,0)  {Predefined process};

% Left restangle
\draw (PProcess.north west) -- ++ (-0.3,0) |- (PProcess.south west) ;

% Right rectangle
\draw (PProcess.north east) -- ++ (0.3,0) |- (PProcess.south east) ;

\end{tikzpicture}

\end{document}
How to draw an arrow with text in LaTeX?
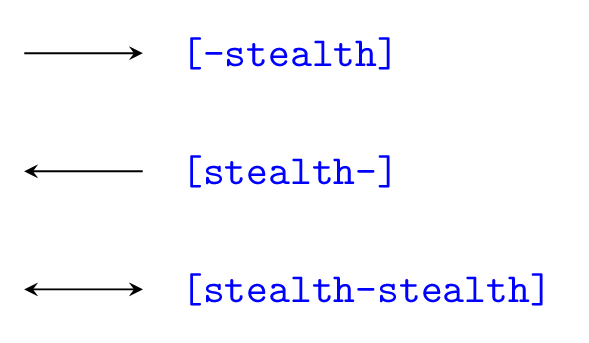
Drawing an arrow in LaTeX can be done easily by providing one of these options to the drawing command:
1) -arrowheadName
2) arrowheadName-
3) or arrowheadName-arrowheadName
Here is an example of stealth, arrowhead style. For more details, check this post: TikZ arrows.
\draw[-stealth] (0,0) -- (2,0);
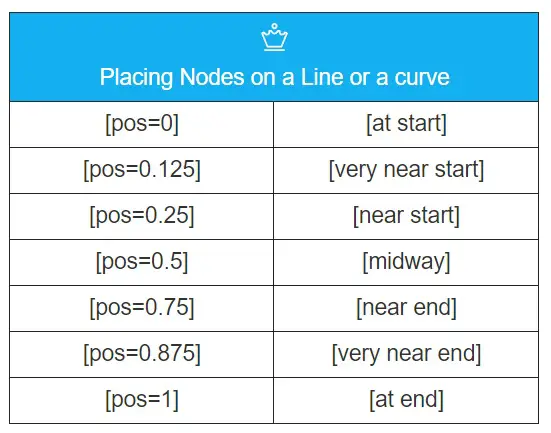
An arrow with text label can be created by adding a node to the above line of code. The node has options for positioning:
- position with respect to the path, can be set using one of the options shown in the following table:
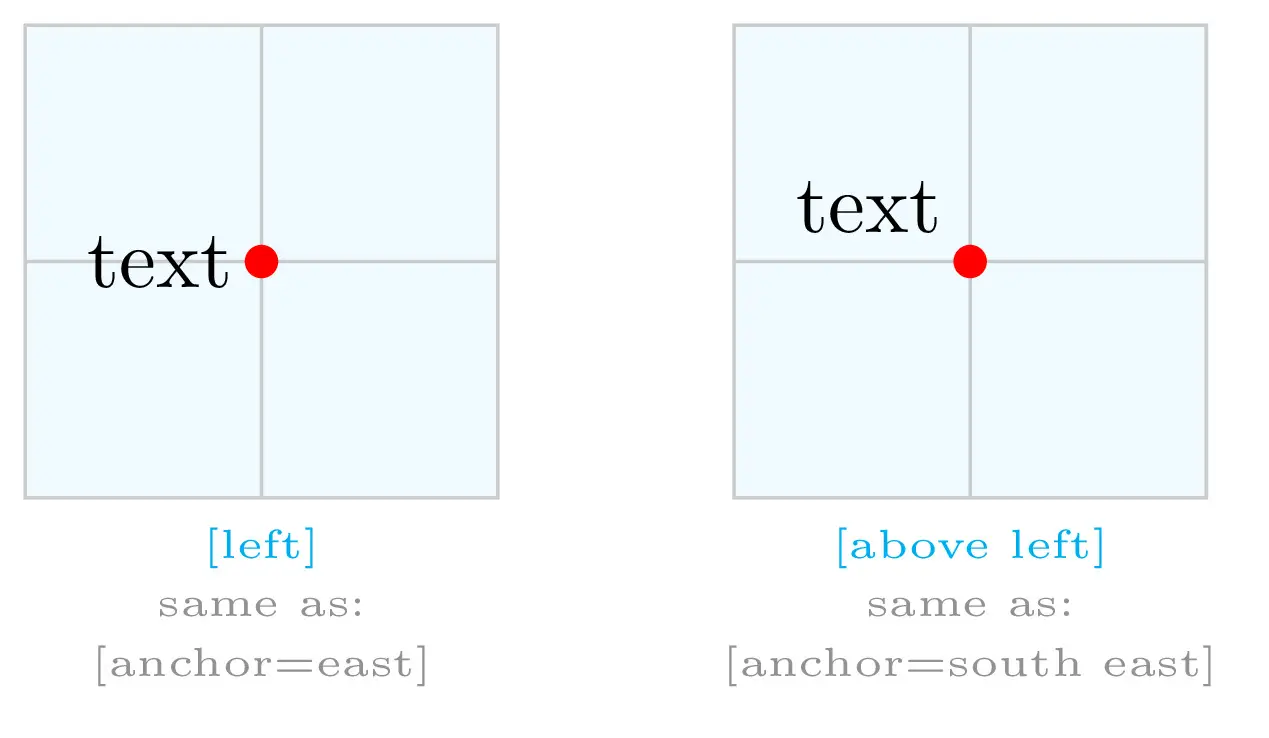
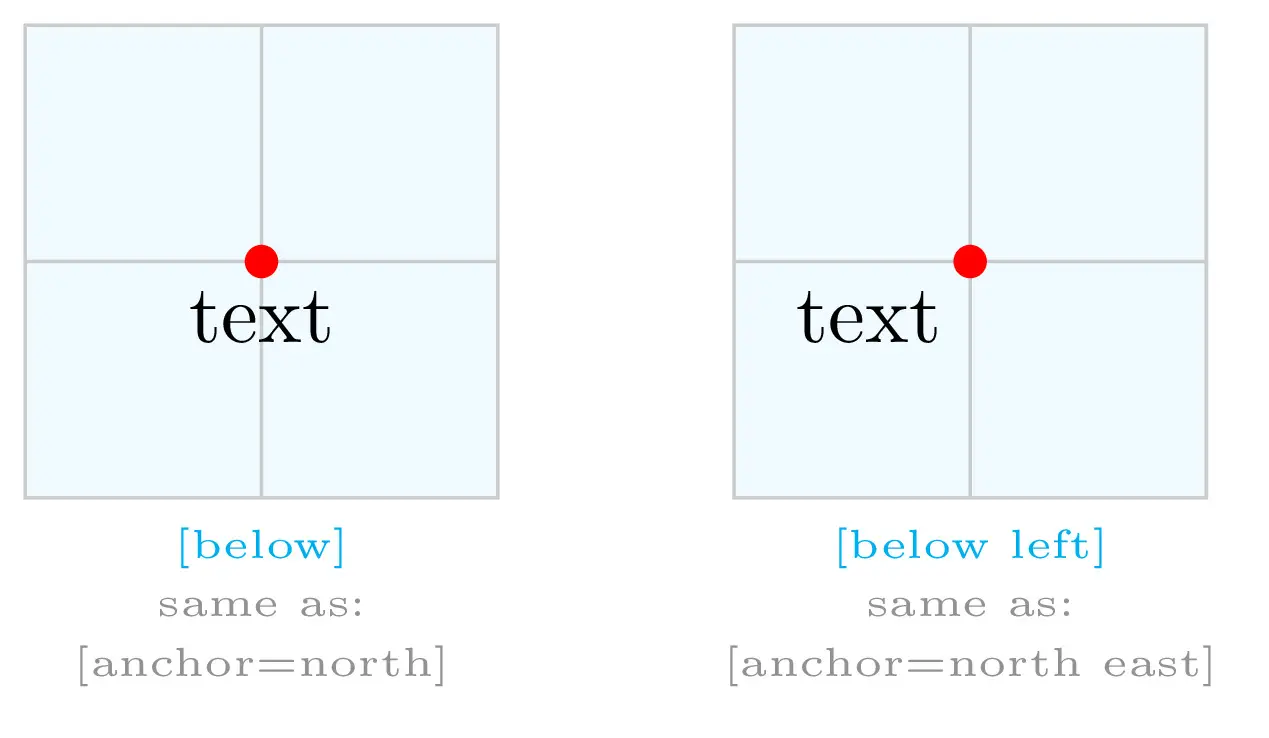
- Once the position of the node is fixed, we choose the label position with respect to the node: above, below, right, left, above right, above left, below right, below left. Check the following illustrations or read how to annotate an image in LaTeX (Positioning section).
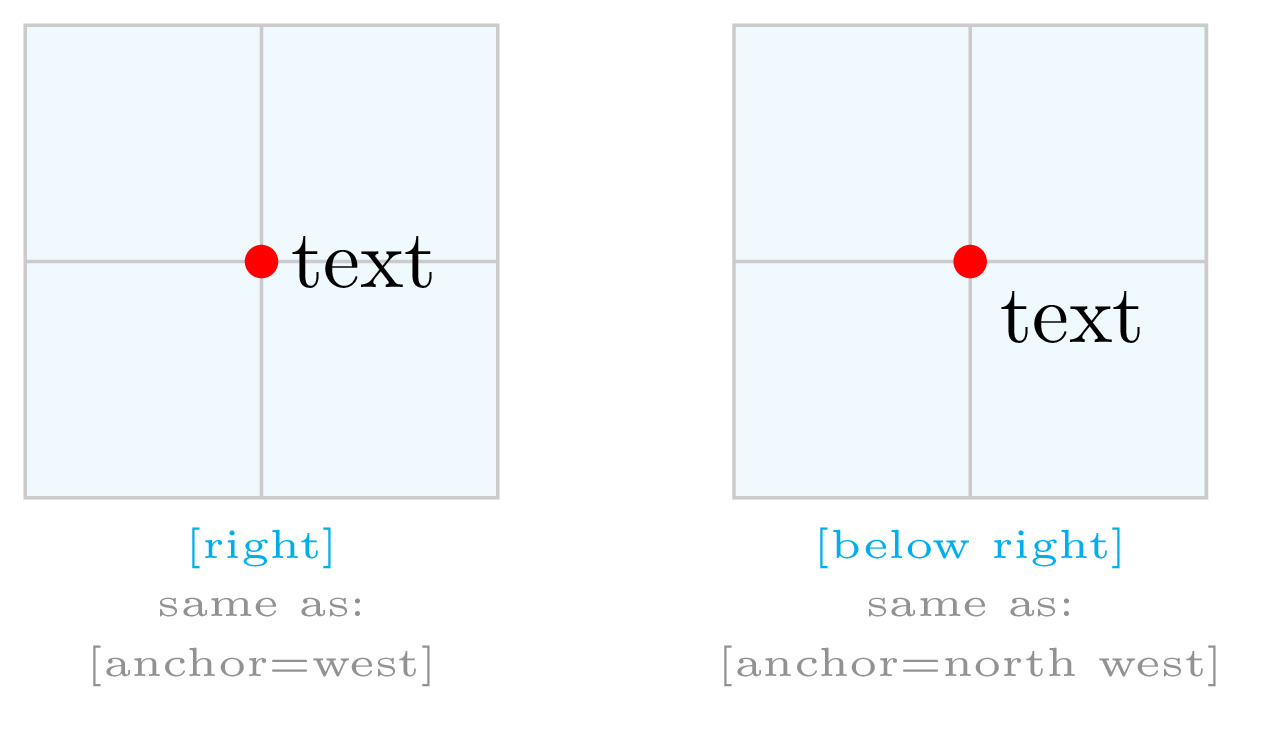
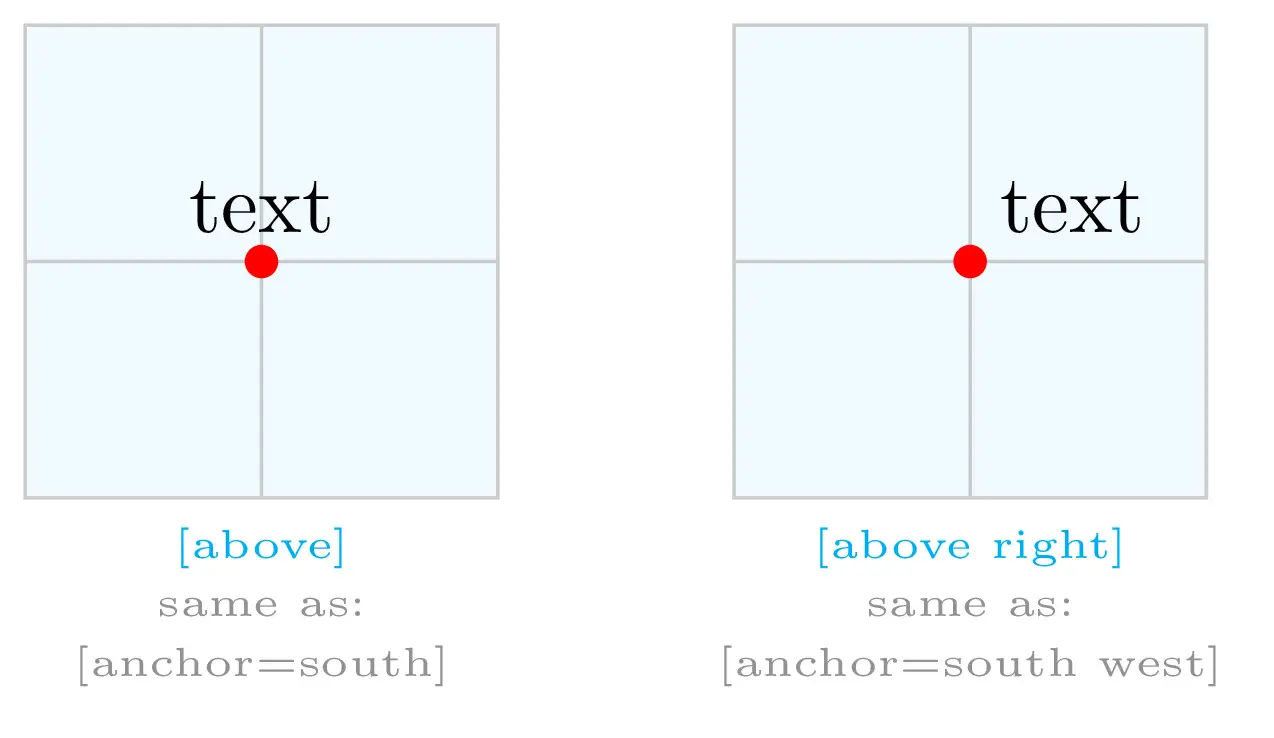
The following example highlights text node positioning:
 \documentclass[border=0.2cm]{standalone}

% required packages and libraries
\usepackage{tikz}
\usetikzlibrary{shapes}

\begin{document}

\begin{tikzpicture}
\draw[|-latex] (0,0) node[left]{START} -- (10,0)
	node[right]{END}
	node[pos=0.1,fill=white]{1}
	node[pos=0.2,above]{2}
	node[pos=0.3,below]{3}
	node[pos=0.5,above left]{4}
	node[pos=0.5,above right]{5}
	node[pos=0.5,below left]{6}
	node[pos=0.5,below right]{7}
	node[pos=0.5,fill=yellow,inner sep=1pt]{8}
	node[pos=0.7,fill=yellow,circle,inner sep=1pt]{9}
	node[pos=0.9,fill=orange!50,diamond,inner sep=1pt]{10};
\end{tikzpicture}

\end{document}
Which yields the following TikZ illustration:

Let's move to the practice session 
Flowchart Examples in LaTeX
The next illustration corresponds to the Perturb & Observe MPPT Flowchart drawn in LaTeX using the tutorial instructions. The flowchart is about tracking the maximum power point using the algorithm P&O. For curious guys, check the wikipedia Link.
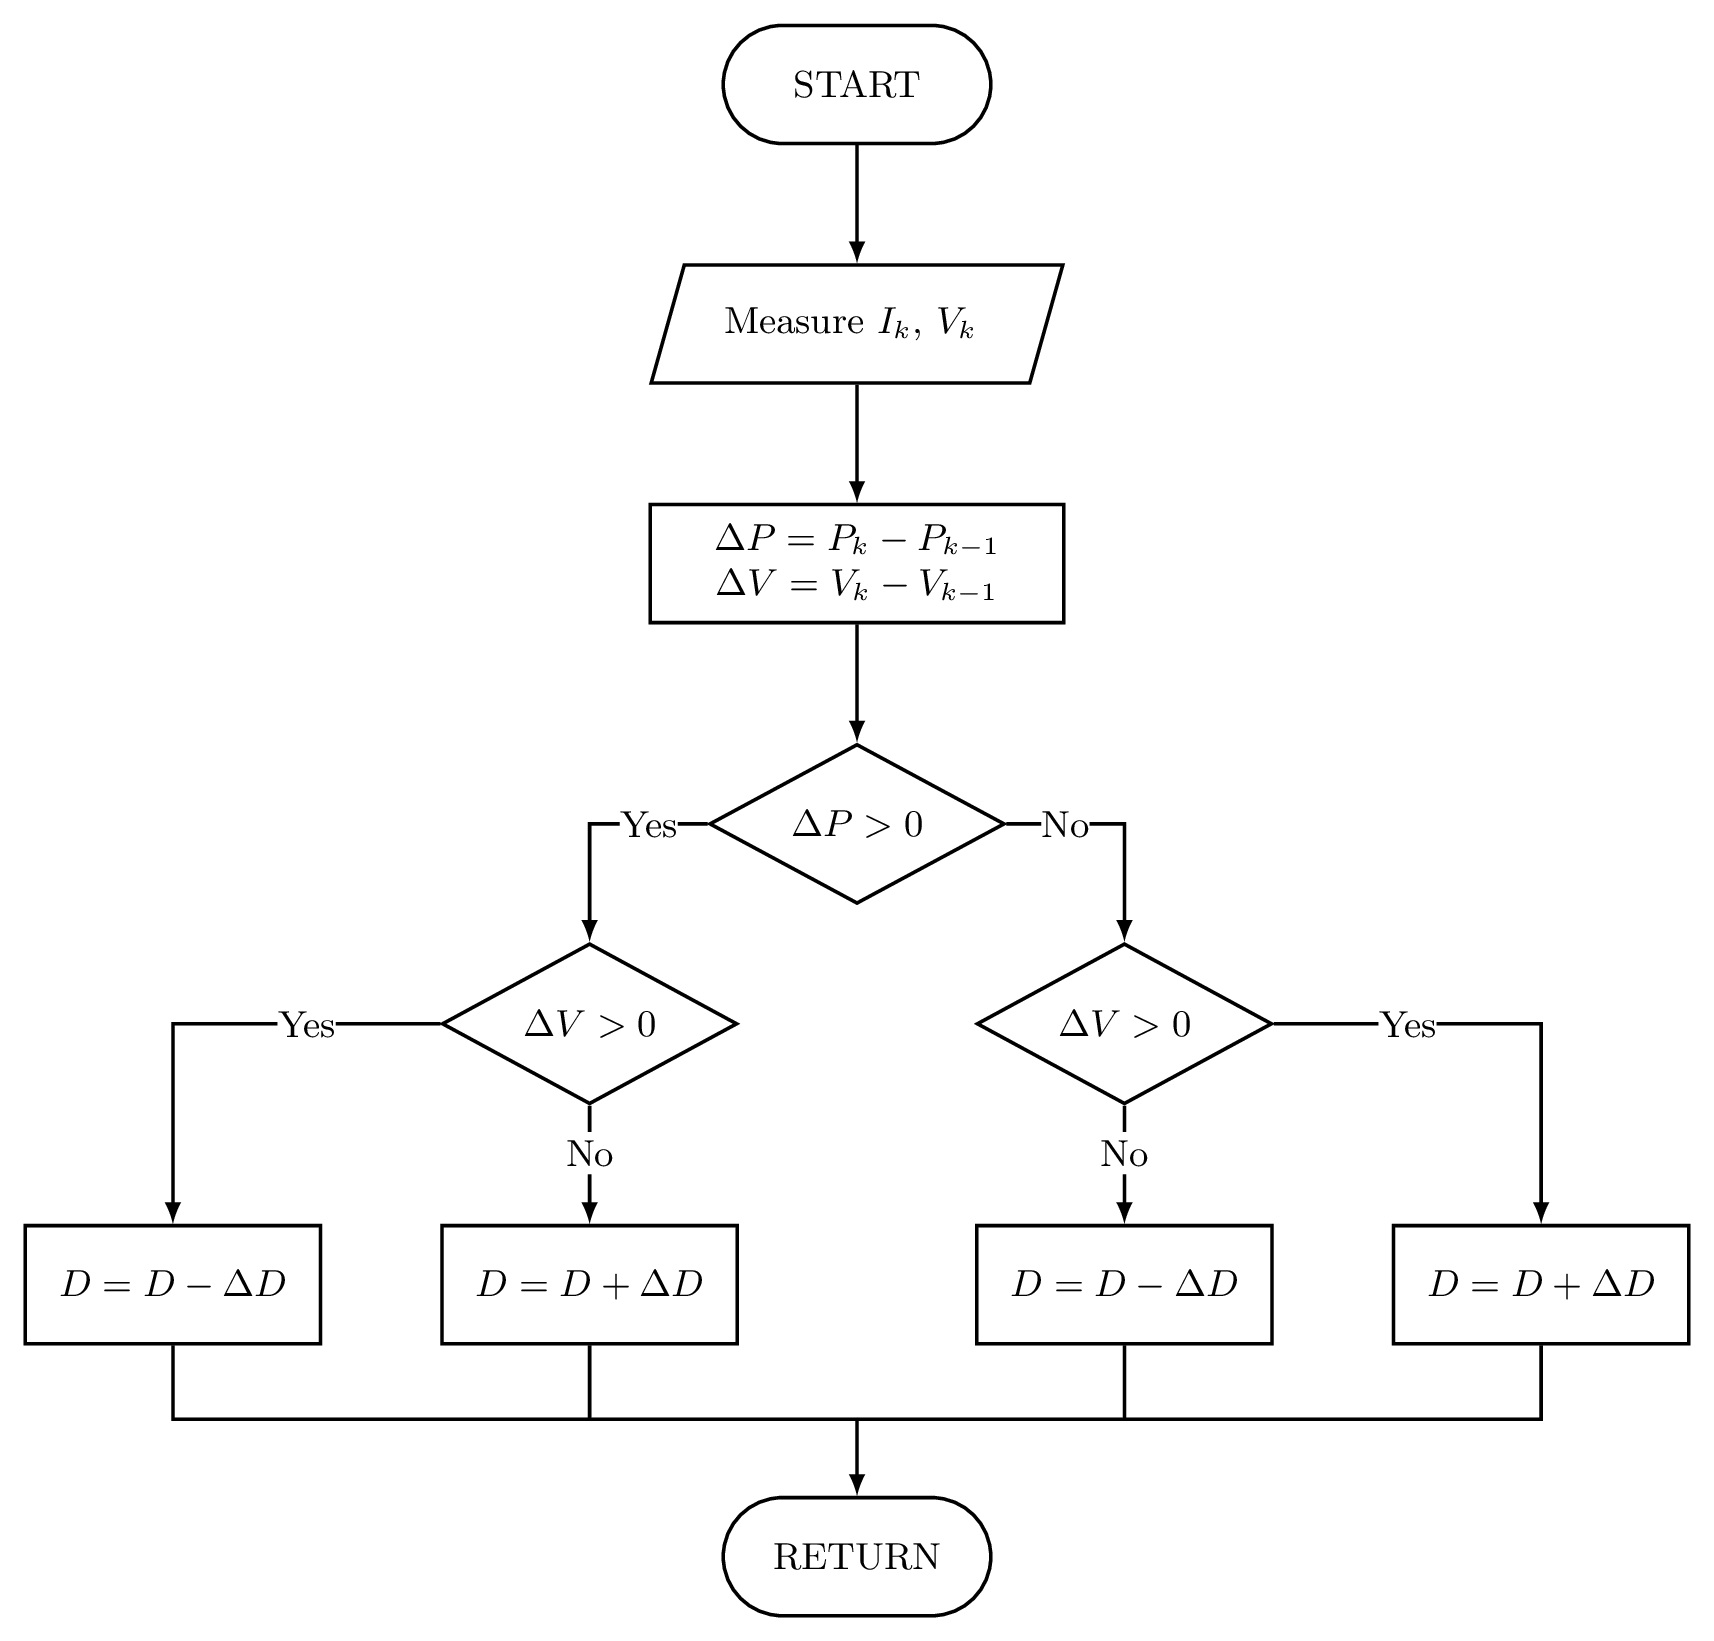
\documentclass[border=0.2cm]{standalone}

% Required packages
\usepackage{tikz}
\usetikzlibrary{shapes,positioning}

\begin{document}

\begin{tikzpicture}[font=\small,thick]

% Start block
\node[draw,
	rounded rectangle,
	minimum width=2.5cm,
	minimum height=1cm] (block1) {START};

% Voltage and Current Measurement
\node[draw,
	trapezium,
	trapezium left angle = 65,
	trapezium right angle = 115,
	trapezium stretches,
	below=of block1,
	minimum width=3.5cm,
	minimum height=1cm
] (block2) { Measure $I_k$, $V_k$ };

% Power and voltage variation
\node[draw,
	below=of block2,
	minimum width=3.5cm,
	minimum height=1cm
] (block3) { $\Delta P=P_k-P_{k-1}$ \\ $\Delta V=V_k-V_{k-1}$};

% Conditions test
\node[draw,
	diamond,
	below=of block3,
	minimum width=2.5cm,
	inner sep=0] (block4) { $\Delta P>0$};

\node[draw,
	diamond,
	below left=of block4,
	minimum width=2.5cm,
	inner sep=0] (block5) { $\Delta V>0$};

\node[draw,
	diamond,
	below right=of block4,
	minimum width=2.5cm,
	inner sep=0] (block6) { $\Delta V>0$};

% Increase and Decrease duty cycle
\node[draw,
	below=of block5,
	minimum width=2.5cm,
	minimum height=1cm] (block7) { $D=D+\Delta D$};

\node[draw,
	left=of block7,
	minimum width=2.5cm,
	minimum height=1cm] (block8) { $D=D-\Delta D$};

\node[draw,
	below=of block6,
	minimum width=2.5cm,
	minimum height=1cm] (block9) { $D=D-\Delta D$};

\node[draw,
	right=of block9,
	minimum width=2.5cm,
	minimum height=1cm] (block10) { $D=D+\Delta D$};

% Return block
\node[draw,
	rounded rectangle,
	below=5cm of block4,
	minimum width=2.5cm,
	minimum height=1cm,] (block11) { RETURN};

\node[coordinate,below=4.35cm of block4] (block12) {};


% Arrows
\draw[-latex] (block1) edge (block2)
	(block2) edge (block3)
	(block3) edge (block4);

\draw[-latex] (block4) -| (block5)
	node[pos=0.25,fill=white,inner sep=0]{Yes};

\draw[-latex] (block4) -| (block6)
	node[pos=0.25,fill=white,inner sep=0]{No};

\draw[-latex] (block5) edge node[pos=0.4,fill=white,inner sep=2pt]{No}(block7)
	(block5) -| (block8)
		node[pos=0.25,fill=white,inner sep=0]{Yes};

\draw[-latex] (block6) edge node[pos=0.4,fill=white,inner sep=2pt]{No}(block9)
	(block6) -| (block10)
		node[pos=0.25,fill=white,inner sep=0]{Yes};

\draw (block7) |- (block12);
\draw (block9) |- (block12);
\draw (block8) |- (block7|-block12);
\draw (block10) |- (block9|-block12);
\draw[-latex] (block12) -- (block11);

\end{tikzpicture}

\end{document}


Awesome! Perfect material and examples while drawing decent flowcharts in Latex.
Thanks Wenyin, I appreciate your feedback 😊.
Hi, thank you for this post. I’d to suggest some modifications in the last example, for instance using
—————————————
\node[draw,
trapezium,
trapezium left angle = 65,
trapezium right angle = 115,
trapezium stretches,
below=of block1,
minimum width=3.5cm,
minimum height=1cm
] (block2) { block2 };
\node[draw,
align=center,
below=of block2,
minimum width=3.5cm,
minimum height=1cm
] (block3) { block3};
——————————————
make it much easier to follow the code.
Thanks again for your effort!
Many thanks Pablo for the suggestion, I appreciate it 😊!