Node shape rectangle in TikZ
A rectangle shape can be drawn by using the option rectangle to the \node command. Following line creates a rectangle node named (r) at coordinate (0,0).
\documentclass[border=0.2cm]{standalone}

% Required package
\usepackage{tikz}

\begin{document}

\begin{tikzpicture}

	\node[rectangle] (r) at (0,0) {};

\end{tikzpicture}

\end{document}
Compiling this code displays nothing. The rectangle node will be drawn only if we provide draw option to the node command as follows:
\documentclass[border=0.2cm]{standalone}

% Required package
\usepackage{tikz}

\begin{document}

\begin{tikzpicture}

	\node[rectangle,draw] (r) at (0,0) {};

\end{tikzpicture}

\end{document}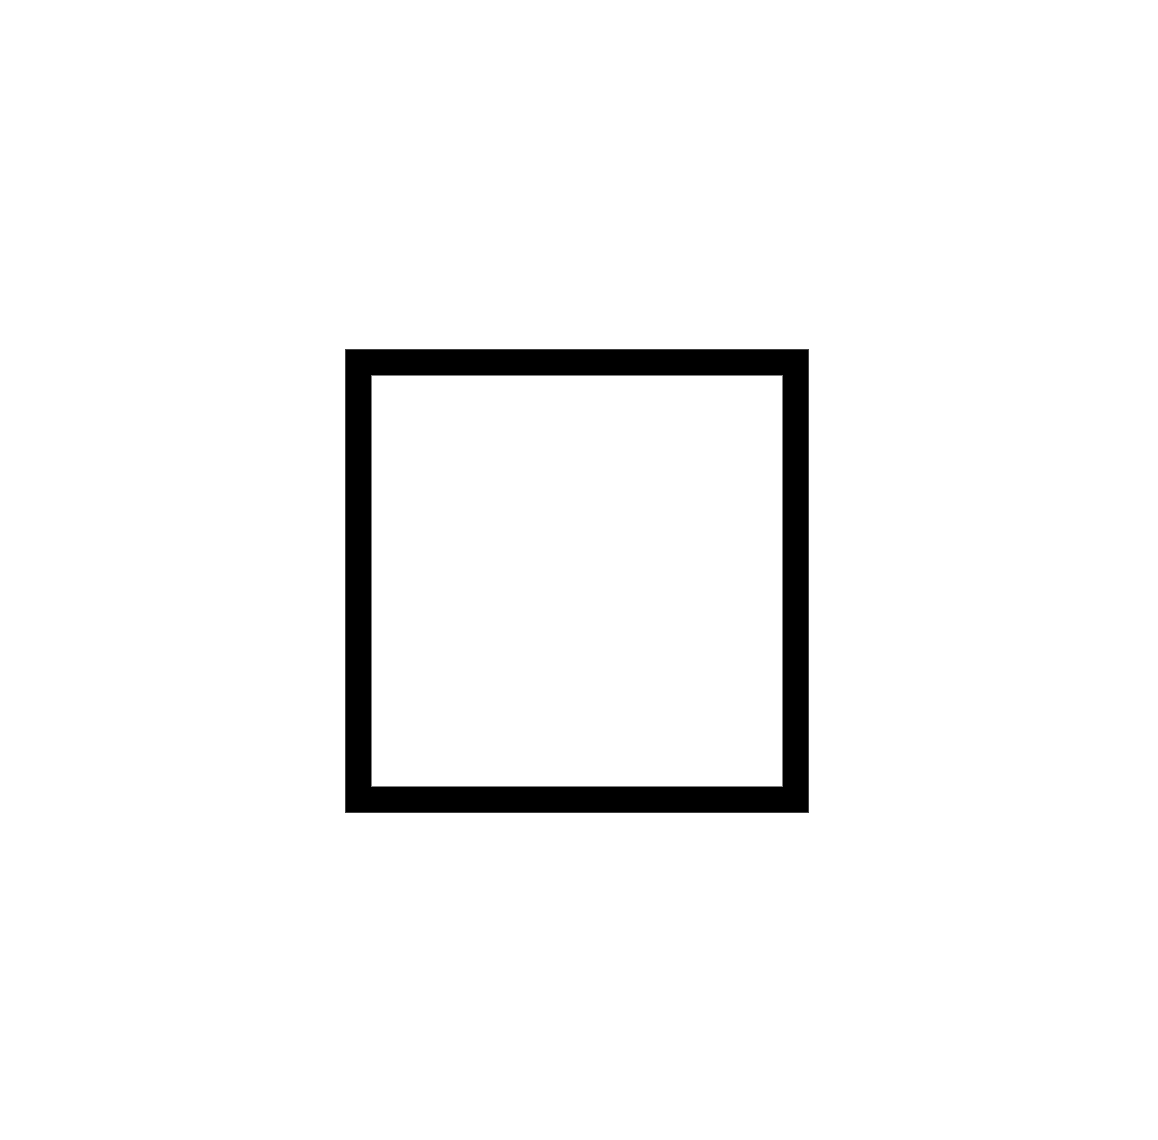
Add text to the rectangle node
The previous code creates a rectangle node with empty content. Text can be added inside the rectangle node by putting it between the curly braces {} as follows.
\documentclass[border=0.2cm]{standalone}

% Required package
\usepackage{tikz}

\begin{document}

\begin{tikzpicture}

	\node[rectangle,draw] (r) at (0,0) {Rectangle};

\end{tikzpicture}

\end{document}
To fit the text inside the shape, this code yields to a rectangle with a size depends on its content:

Change text color of the rectangle node
In the previous section, we have added content to the rectangle node and now we would like to change the text color. This can be achieved by providing the option text = <color> to the \node command:
\documentclass[border=0.2cm]{standalone}

% Required package
\usepackage{tikz}

\begin{document}

\begin{tikzpicture}

\node[rectangle,
	draw,
	text = olive] (r) at (0,0) {Rectangle};

\end{tikzpicture}

\end{document}
Add filling color to a node
The rectangle node can be filled with any color using the option fill = <color>. Here is an illustrative example of a dark green filling with our olive text:
\documentclass[border=0.2cm]{standalone}

% Required package
\usepackage{tikz}

\begin{document}

\begin{tikzpicture}

\node[rectangle,
	draw,
	text = olive,
	fill = green!30!black] (r) at (0,0) {Rectangle};

\end{tikzpicture}

\end{document}
Change the border line color of a node
The rectangle border color can be modified (default is black) by providing the color name to the draw option draw = <color>. Here is an example of a rectangle filled with dark green, has olive text and light gray border:
\documentclass[border=0.2cm]{standalone}

% Required package
\usepackage{tikz}

\begin{document}

\begin{tikzpicture}

\node[rectangle,
	draw = lightgray,
	text = olive,
	fill = green!30!black] (r) at (0,0) {Rectangle};

\end{tikzpicture}

\end{document}
Change the size of a rectangle node
We mentioned above that the size of a rectangle depends on its content. This is always true and we can set only the minimum size of a rectangle. We can arrange a minimum size for its width with minimum width option, and similarly, we can set its height with minimum height option. Below, we set the minimum width value to 2 cm and the minimum height value to 1 cm.
\documentclass[border=0.2cm]{standalone}

% Required package
\usepackage{tikz}

\begin{document}

\begin{tikzpicture}

\node[rectangle,
	draw = lightgray,
	text = olive,
	fill = green!30!black,
	minimum width = 2cm,
	minimum height = 1cm] (r) at (0,0) {Rectangle};

\end{tikzpicture}

\end{document}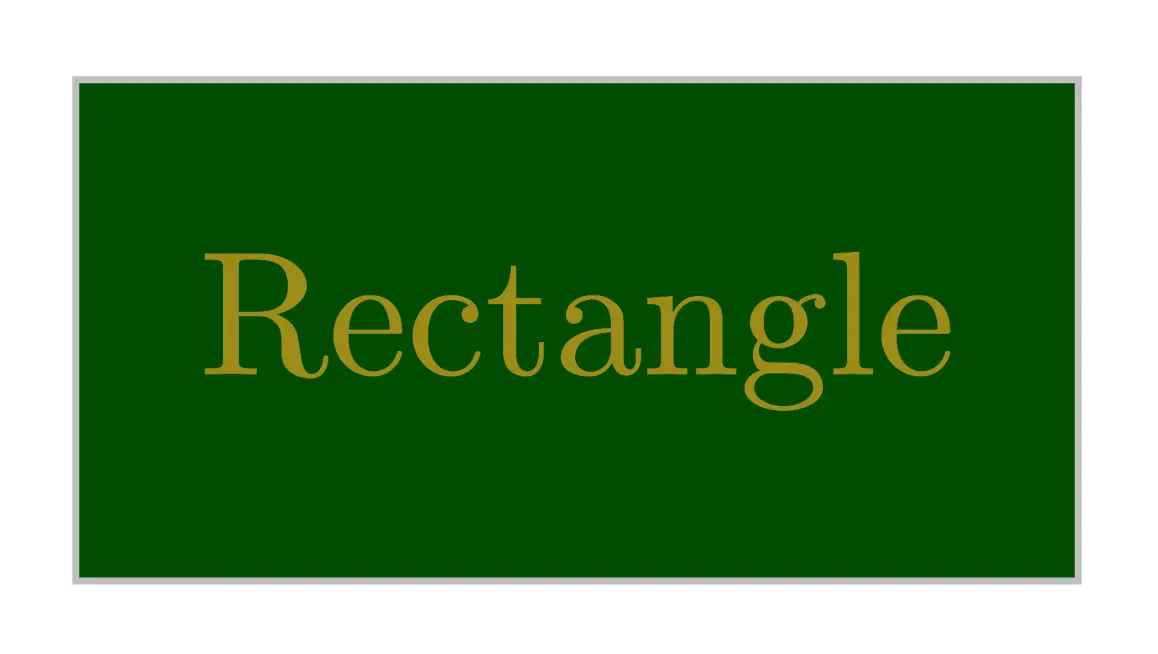
If we need both the width and the length sizes to be the same, we can use minimum size option.
Anchors of a rectangle node
The advantage of using a node rectangle is that it defines a set of anchors that we can use to get coordinates of the node borders or to position nodes with accuracy with respect to given coordinates. By default, node center is positioned at the provided coordinates ((0,0) for the previous examples).
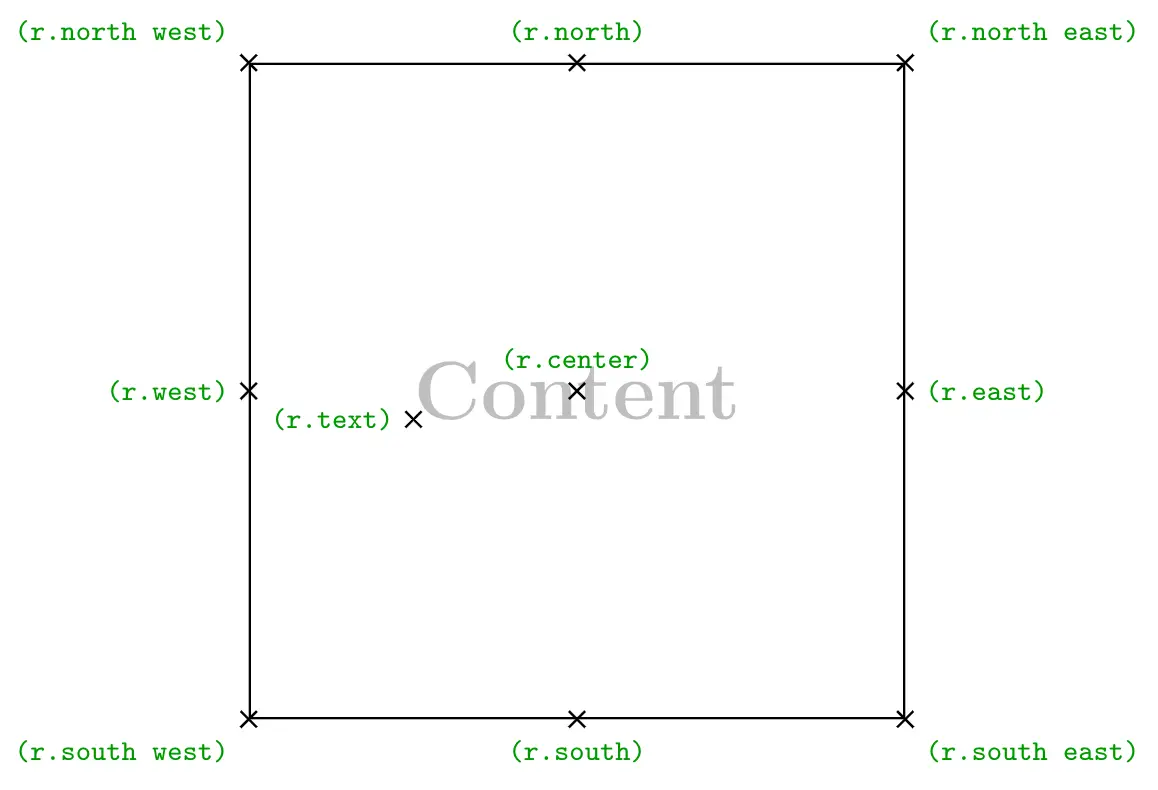
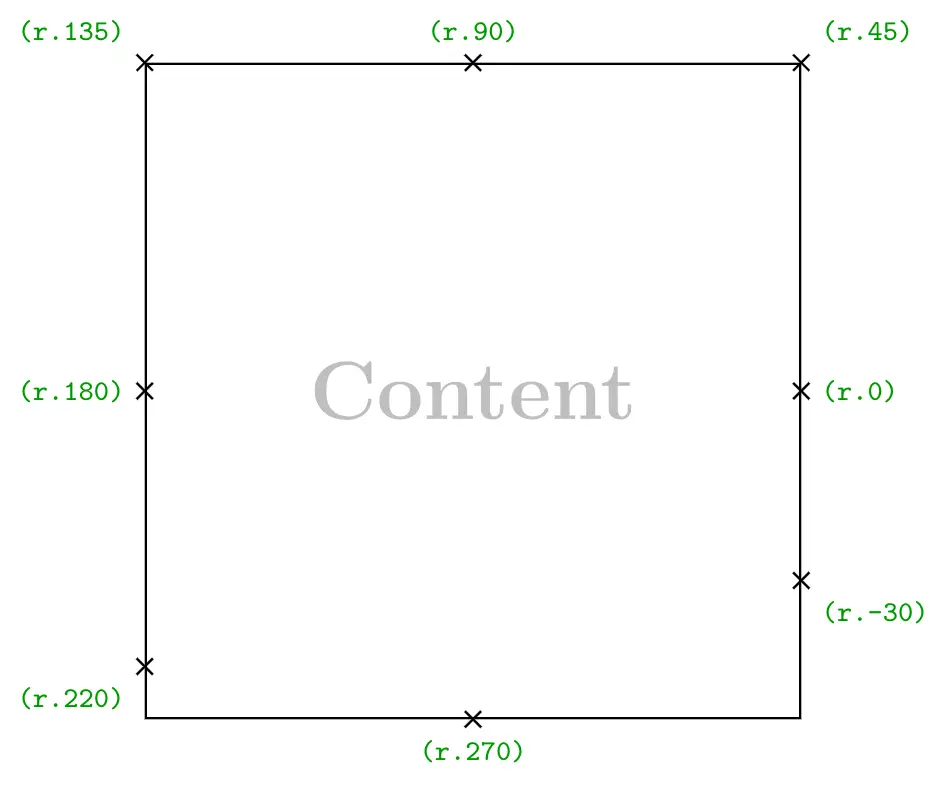
(r.north) represents the coordinates of the point located at the north of the rectangle node where r is the node name. We can also use angles where (r.180) is the coordinates of the point located at the west of the rectangle node.
Adding anchor = west will place the node point (r.west) at the provided coordinate (0,0). Check this post: how to annotate an image in LaTeX (Positioning Nodes using Anchors section).
Outer separation
The above anchors can be moved outside the node border by adding outer sep = <value> to the node command. Here is an example of anchors moved outside the node border with 10pt.
