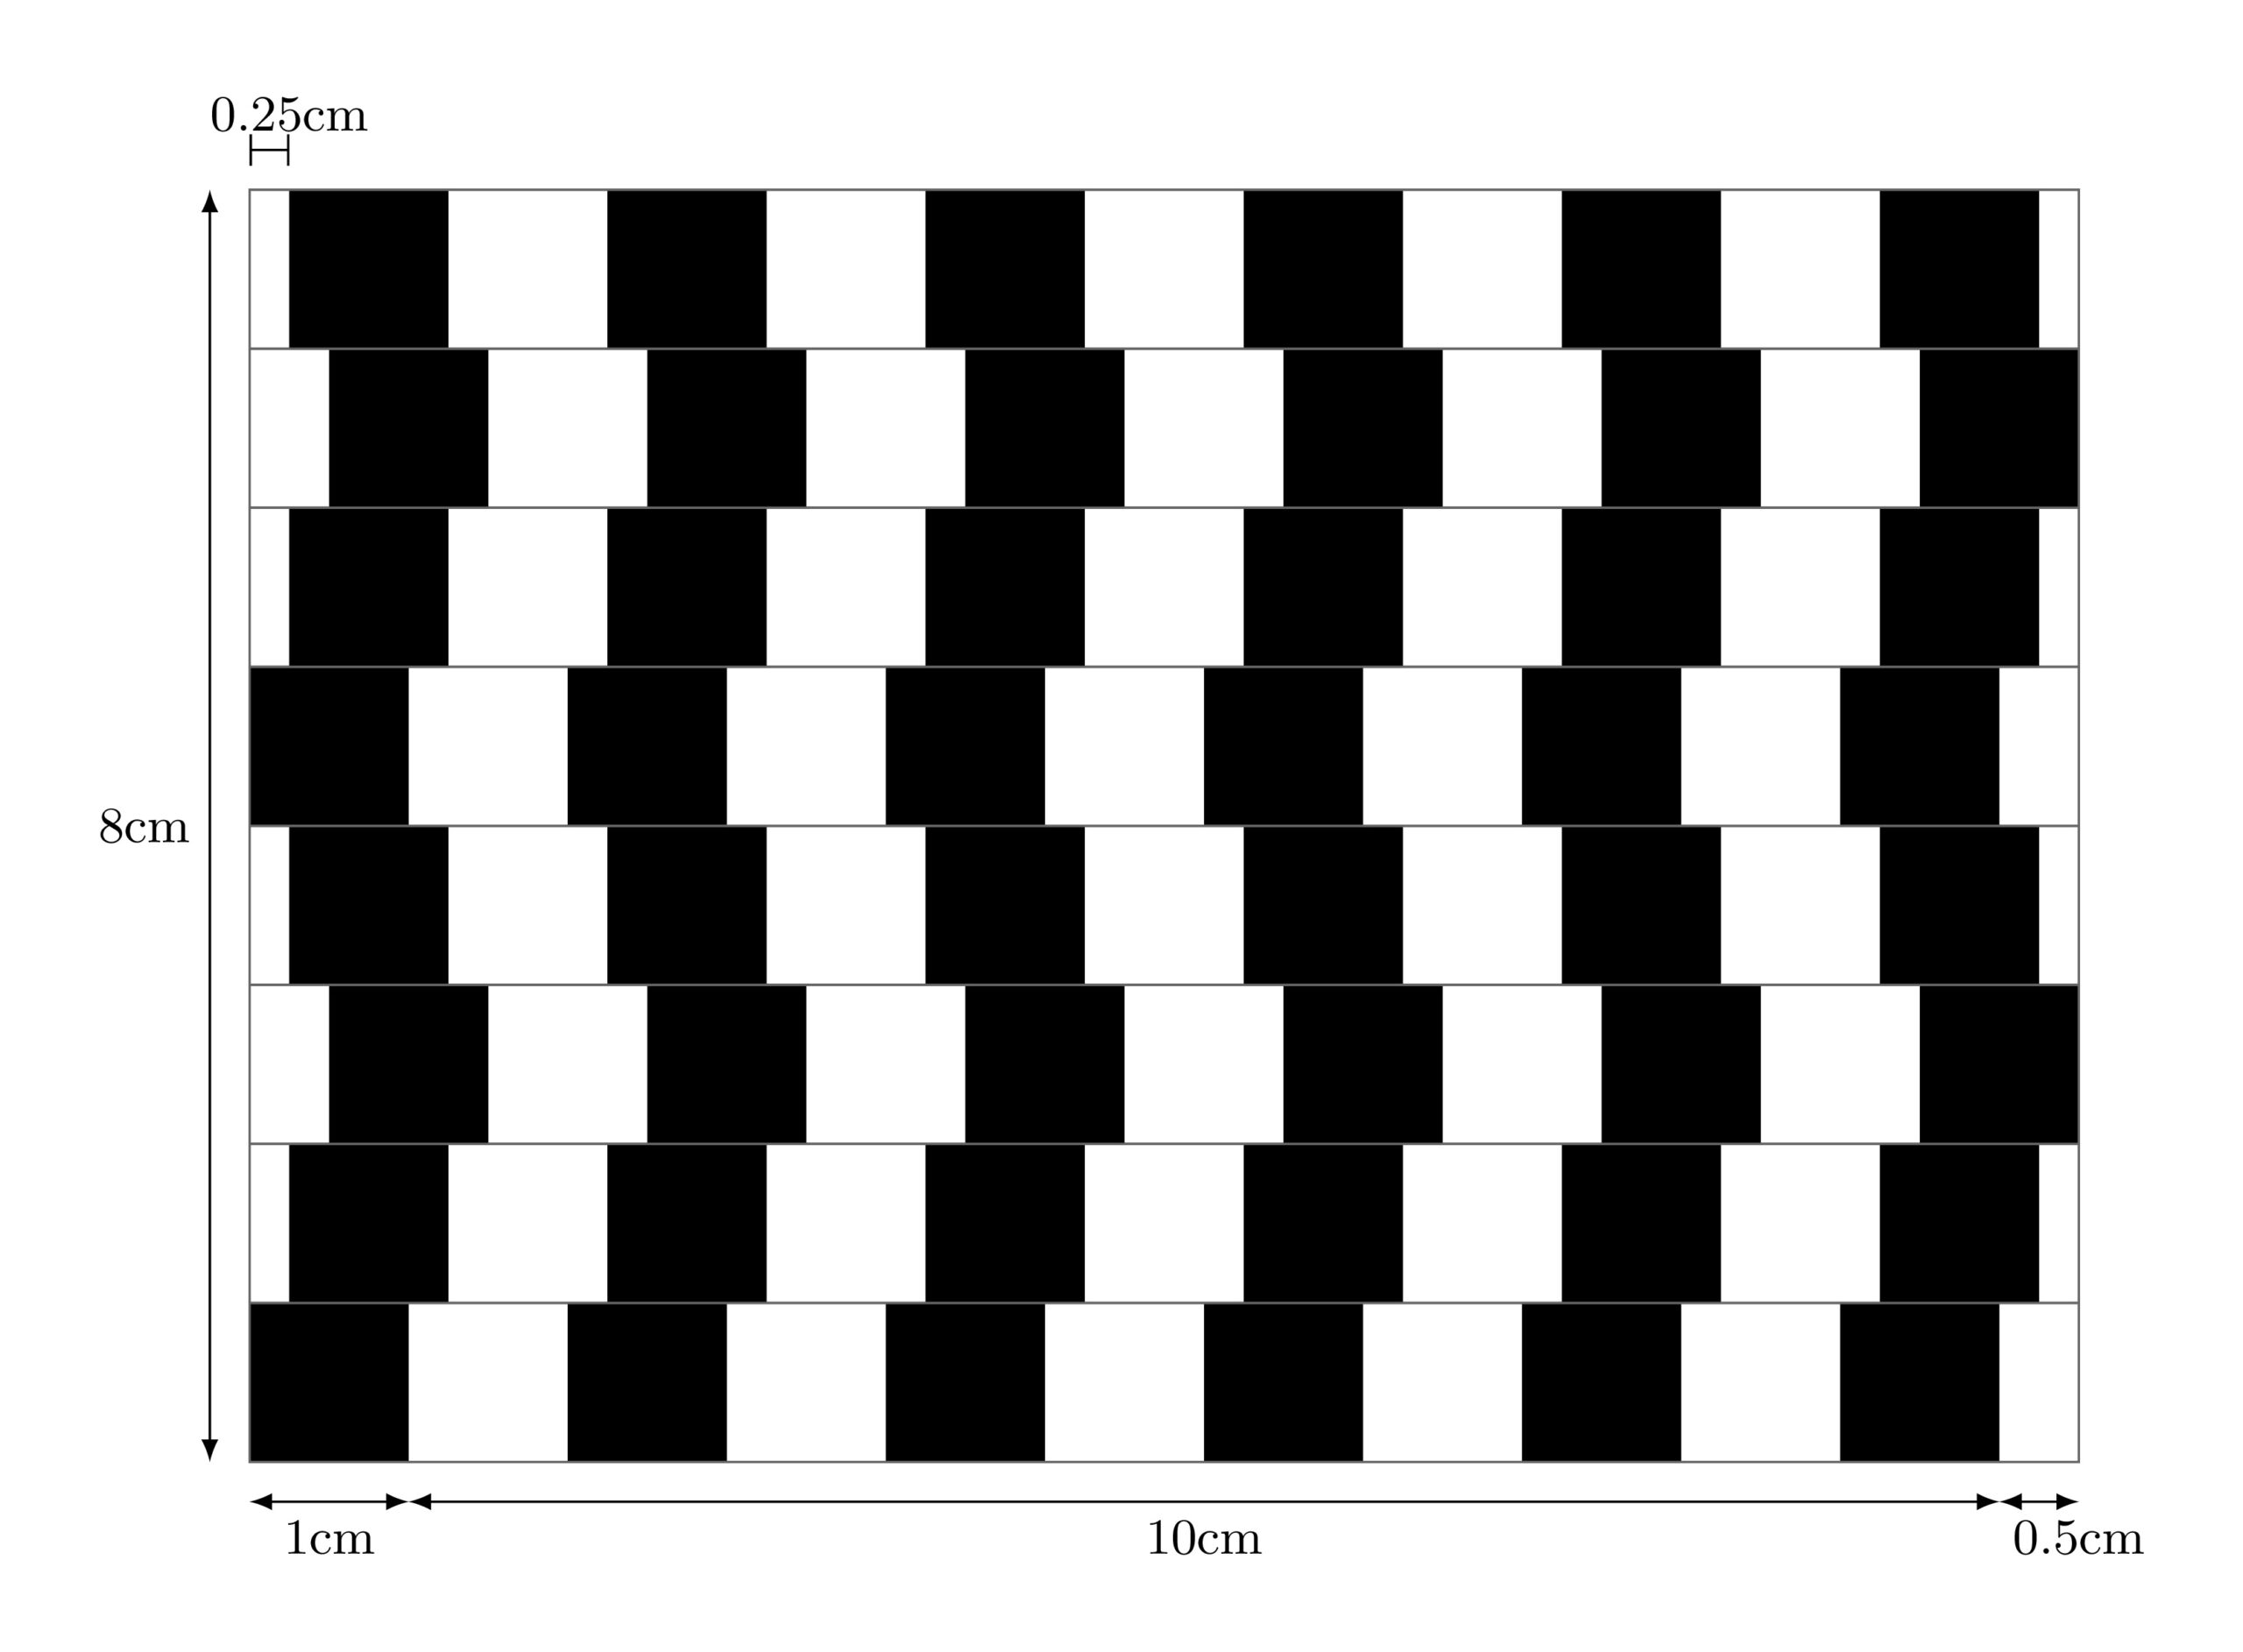
This tutorial was a challenge for me to draw the shifted chessboard illusion in TikZ with a minimal code as possible.
If you ask any TikZ user to draw the next illustration, you will get many interesting ideas about how they see it from a coding point of view.

Simplify your coding journey
Here some comments about the illustration:
Point 1: The illustration consists of rectangles filled with white and black colors;
Point 2: Rows are similar with a shifting along the x-axis by 0.25cm or -0.25cm
For the first point: we can draw rectangles with different filling colors using a foreach loop. But, we can simplify it by drawing a line with the following specifications:
- line width equals to 1cm;
- line style: dashed (1cm on and 1 cm off)
and from here it comes the idea of this tutorial.
For the second point: we will create a loop that draws a dashed line shifted by 1cm along the y-axis and 0.25 (or -0.25) along the x-axis.
\documentclass[tikz,border=0.2cm]{standalone}

\begin{document}

\begin{tikzpicture}

\foreach \i\j in {0/0, 1/0.25,2/0.5,3/0.25,4/0,5/0.25,6/0.5,7/0.25}{

	\draw[line width=1cm,
				dash pattern=on 1cm off 1cm,
				xshift=\j cm] (0,\i) -- ++(11.5,0);

	\draw[black!60] (0,\i-0.5) rectangle ++(11.5,1);
}

\end{tikzpicture}

\end{document}
Customize dashed lines in TikZ
Drawing a line between two points can be easily done using the command \draw (point1) -- (point2); or using relative coordinates \draw (point1) -- ++ (increment);. The line width can be changed by providing the option line width=value to the draw command.
\documentclass[tikz,border=0.2cm]{standalone}

\begin{document}

\begin{tikzpicture}

% Customized dashed line
\draw[ line width=1cm,
	dash pattern=on 1cm off 1cm] (0,0) -- ++(11.5,0);

\end{tikzpicture}

\end{document}
Compiling this code yields:

Customized dashed line in TikZ
The above code draws a line from the point (0,0) to the point with 11.5cm far along the x-axis. The line width is chosen equal to 1cm. The line style is dashed with 1 cm on and 1 cm off using the option: dash pattern=on 1cm off 1cm.
Let's move to the second row!
Shift a path in TikZ
A path can be shifted easily by providing xshift=value cm or yshift=value cm to the path command. If we have multiple paths created with different commands, we can add them inside a scope environment and add the shifting options to the scope.

The above illustration is obtained by the following code:
\documentclass[tikz,border=0.2cm]{standalone}

\begin{document}

\begin{tikzpicture}

% row 1
\draw[ line width=1cm,
	dash pattern=on 1cm off 1cm] (0,0) -- ++(11.5,0);

% row 2
\draw[ line width=1cm,
	dash pattern=on 1cm off 1cm,
	xshift = 0.25cm] (0,1) -- ++(11.5,0);

\end{tikzpicture}

\end{document}
Two parameters have been changed to draw row 2 with respect to row 1.
- One changes the y-axis value of the starting point;
- The second shifts the whole path by 0.25cm along the x-axis.
In total, we have 8 rows and to minimize the code we can use foreach loop.
Use for loop for repetitive shapes
The for loop has two parameters:
- parameter 1: this one is used to set the y-axis value (0,1,2,3,4,5,6 and 7)
- parameter 2: this one is used to set the shifting value (0, 0.25, 0.5, 0.25, 0, 0.25, 0.5 and 0.25 )
Here is the corresponding LaTeX code
\documentclass[tikz,border=0.2cm]{standalone}

\begin{document}

\begin{tikzpicture}

\foreach \i\j in {0/0, 1/0.25,2/0.5,3/0.25,4/0,5/0.25,6/0.5,7/0.25}{

	\draw[line width=1cm,
				dash pattern=on 1cm off 1cm,
				xshift=\j cm] (0,\i) -- ++(11.5,0);
}

\end{tikzpicture}

\end{document}
The first loop variable is named \i and the second loop variable is named \j. For more details, I invite you to check this post how to use foreach loop in LaTeX.
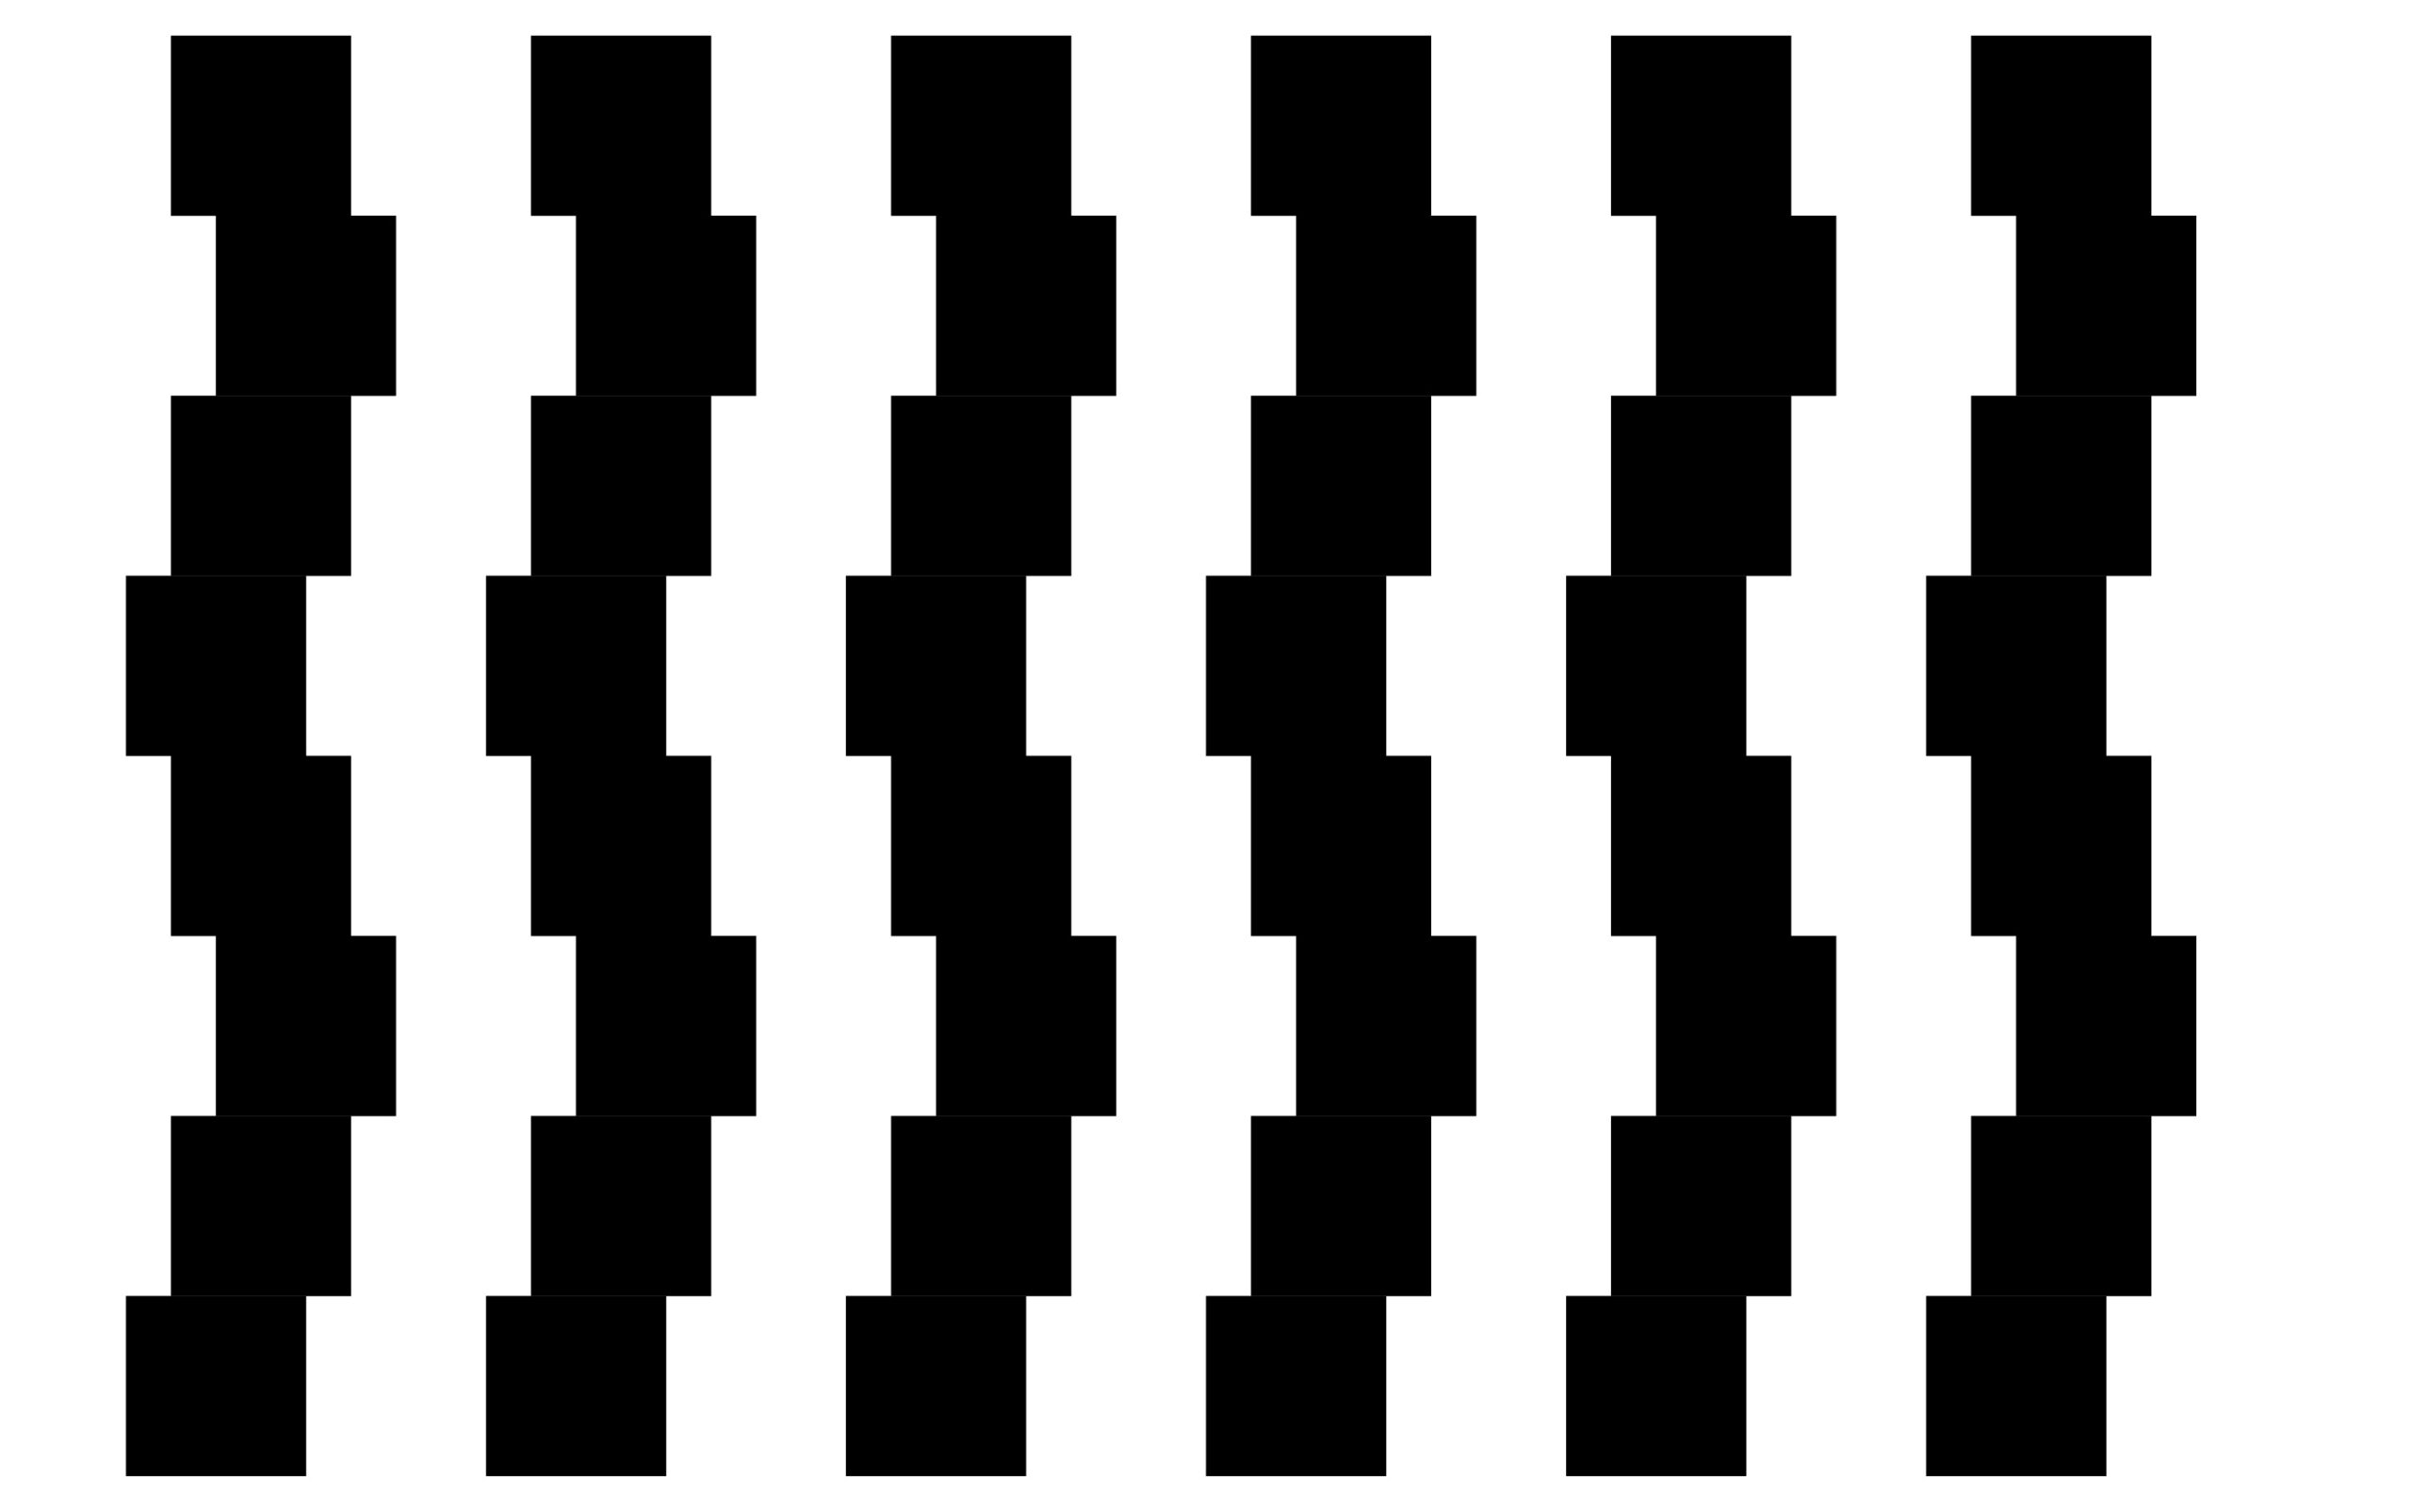
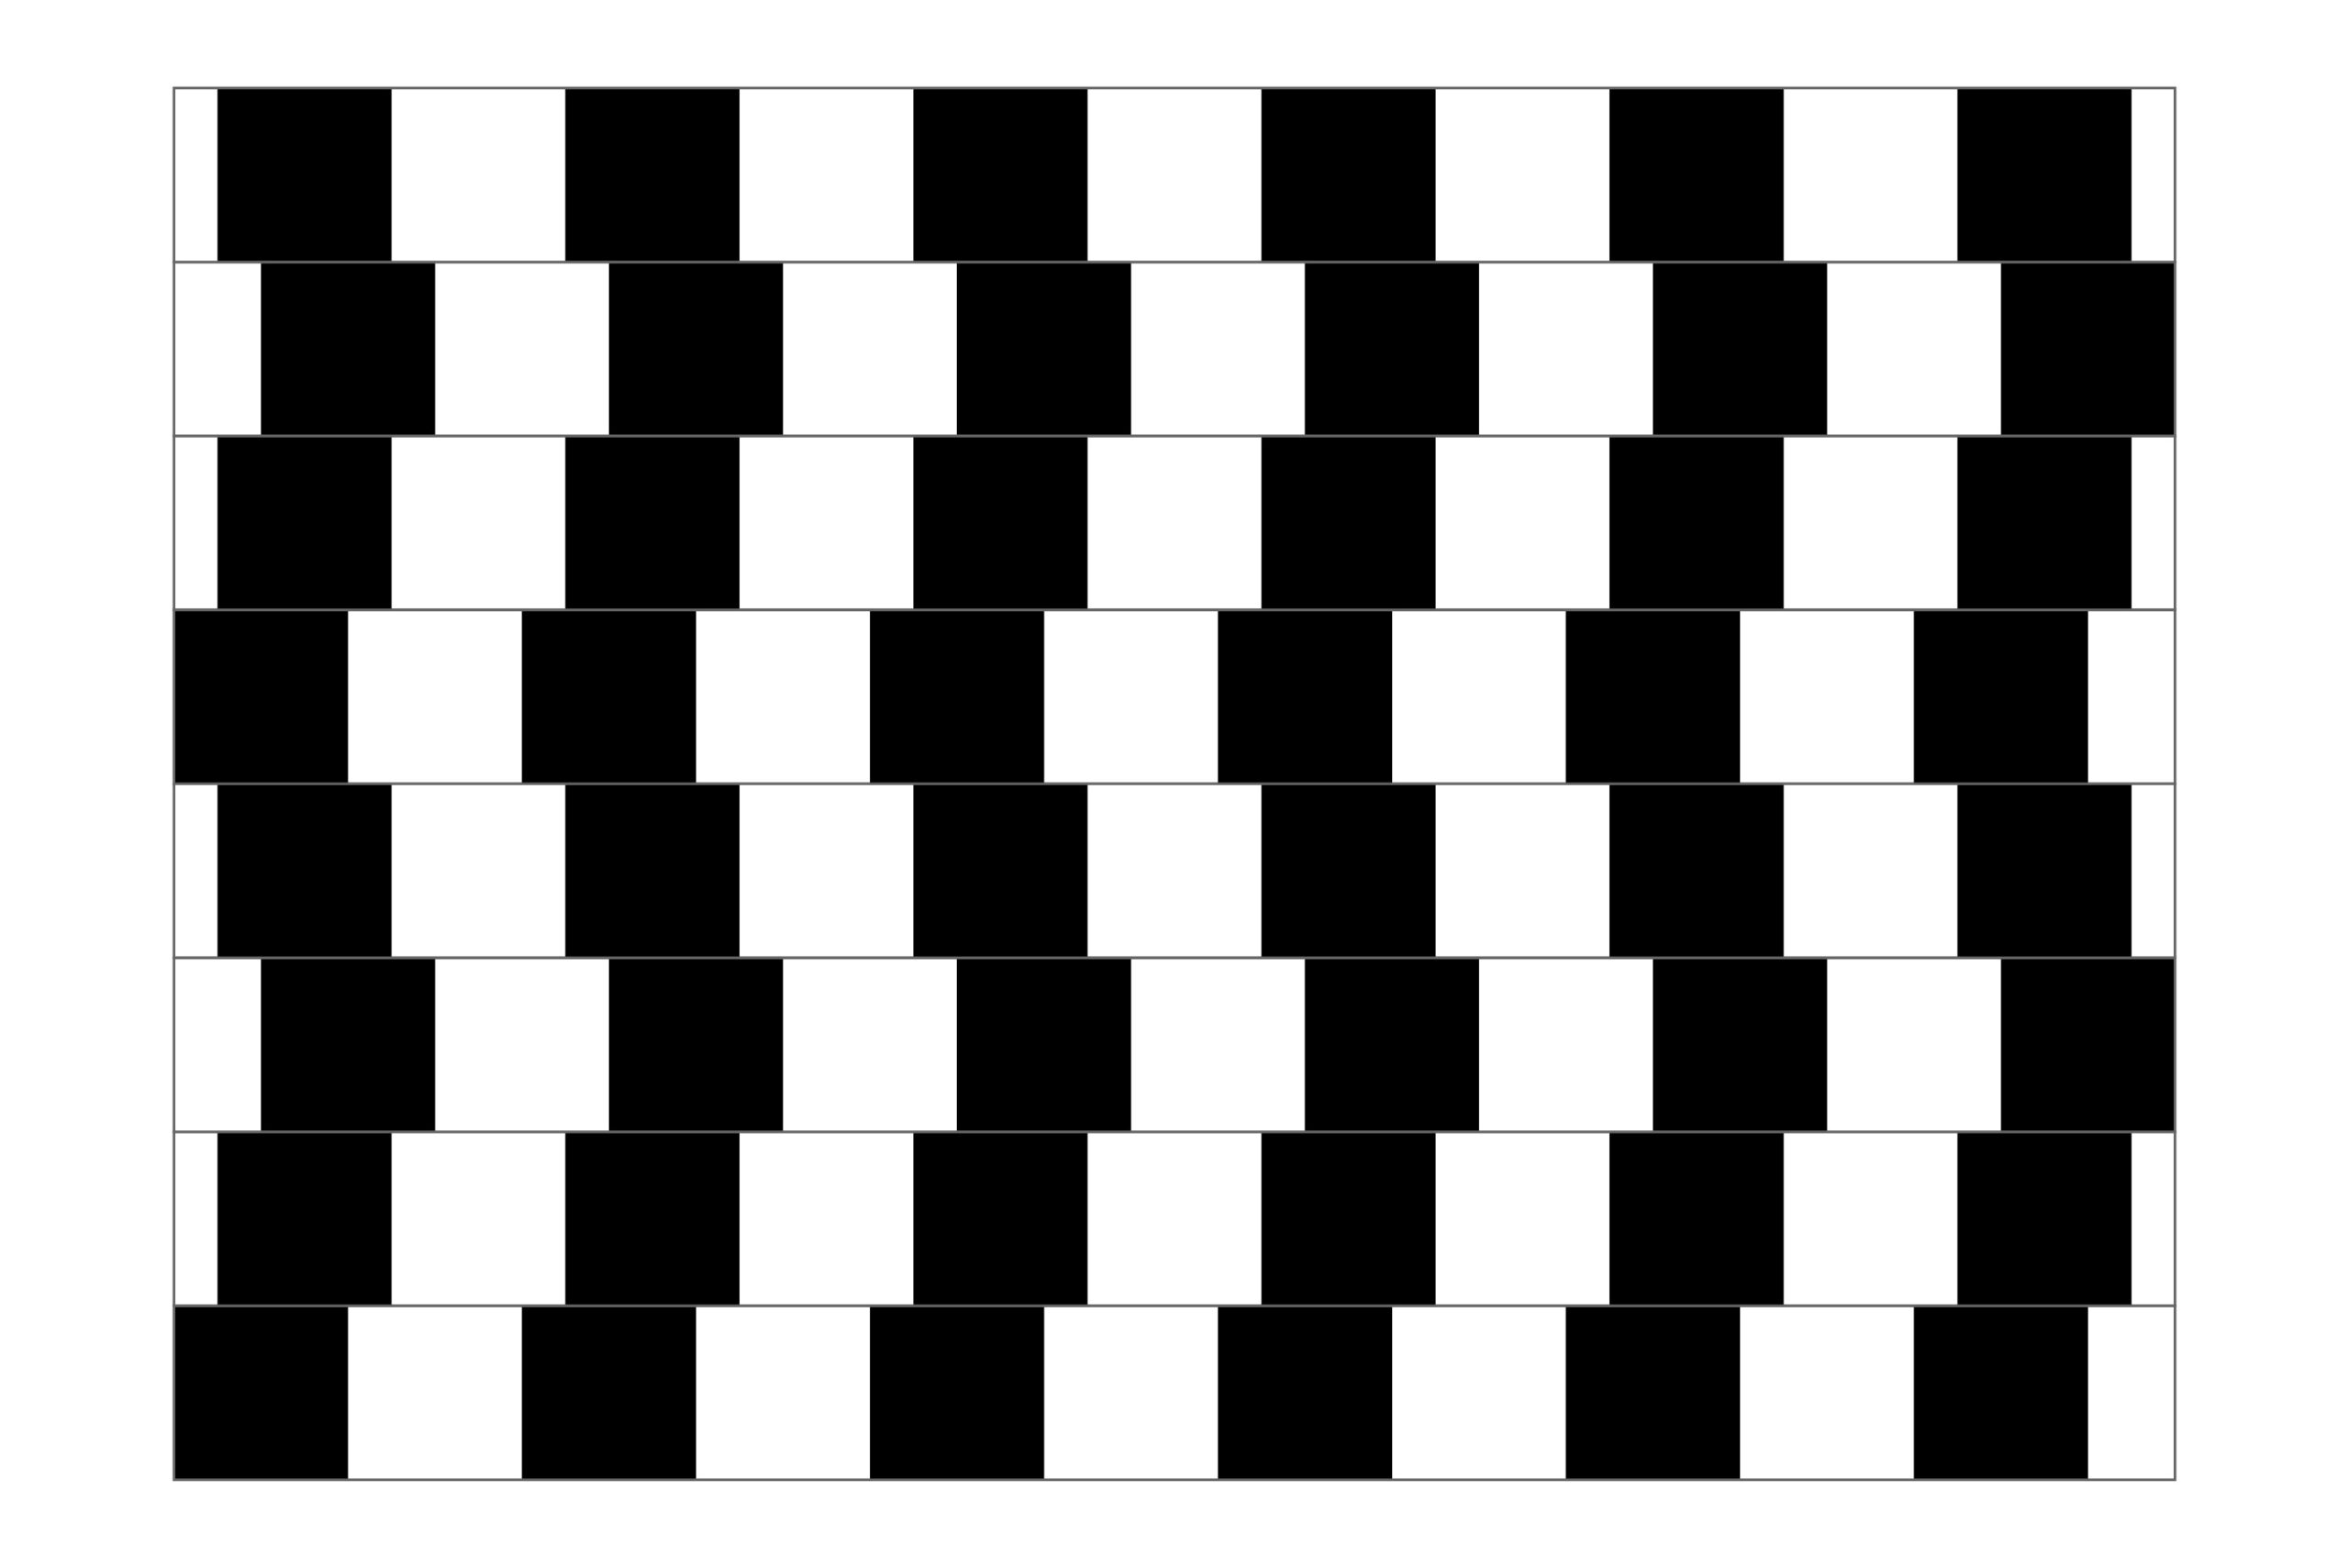
Here is the obtained illustration:

Without a border

With a border
To add a border to each row, we can draw a rectangle at each step of the foreach loop which has 11.5cm width and 1 cm height.
Here is the final code:
\documentclass[tikz,border=0.2cm]{standalone}

\begin{document}

\begin{tikzpicture}

\foreach \i\j in {0/0, 1/0.25,2/0.5,3/0.25,4/0,5/0.25,6/0.5,7/0.25}{

% Draw rows
	\draw[line width=1cm,
				dash pattern=on 1cm off 1cm,
				xshift=\j cm] (0,\i) -- ++(11.5,0);

% Border of each row
	\draw[black!60] (0,\i-0.5) rectangle ++(11.5,1);
}

\end{tikzpicture}

\end{document}
If you have any comments, suggestions or an optimized code, I will be happy to hear from you 
