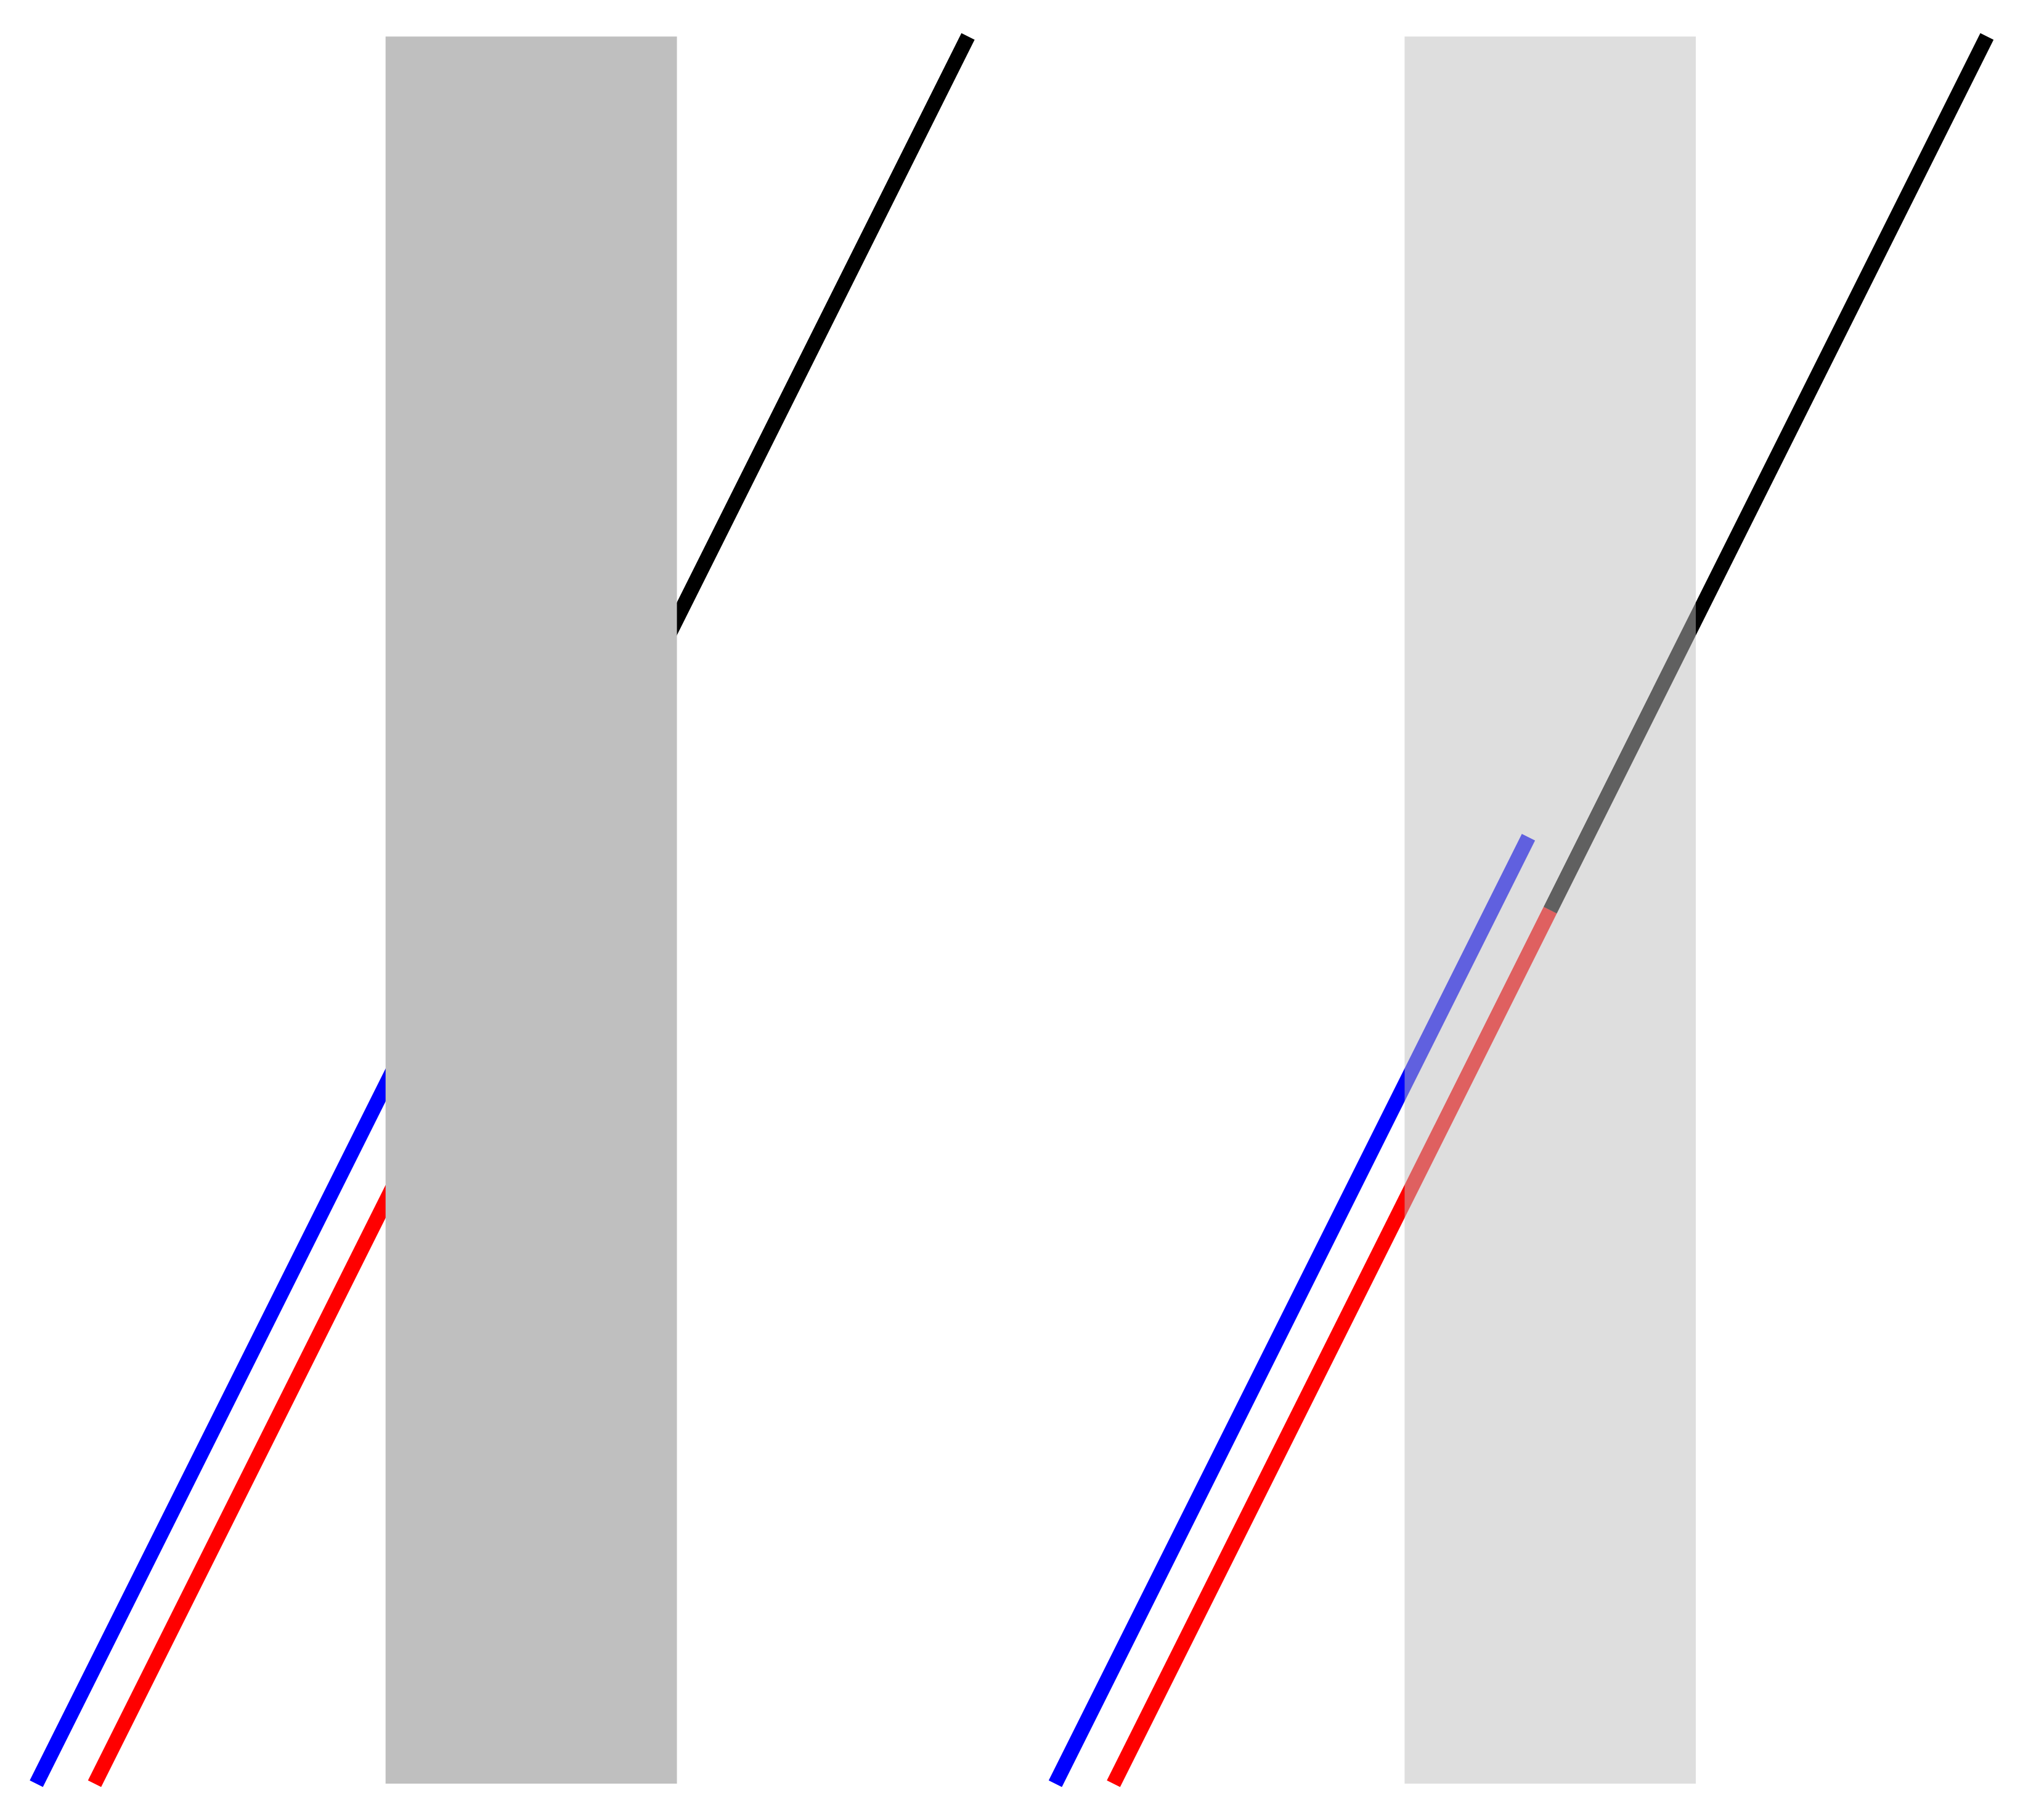
Today's tutorial is about using scope environment in TikZ and for fun we will consider drawing an interesting geometric illusion, known as "The Poggendorff illusion".
This illusion is named after Johann Poggendorff, a German physicist who first described it in 1860.
Look at the image on the left: Does the black line seem to line up with the blue line? In fact, the black line is lined up with the red one, as revealed in the image on the right.

Relative coordinates in TikZ
Compare the following line codes:
\draw (1,2) -- (2,2);
\draw (1,2) -- ++(2,2);
The first one draws a line from the point with coordinates (1,2) to the point with coordinates (2,2).
The second code draws a line from the point with coordinates (1,2) to a relative point that is 2cm far along the x-axis and 2cm far along the y-axis which corresponds to (3,4).
Using relative coordinates, the following code draws three lines (red, black and blue) with 1 mm width:
\documentclass[border=0.2cm]{standalone}

\usepackage{tikz}

\begin{document}


\begin{tikzpicture}

\draw [line width=1mm,red] (0,0) -- ++ (3,6);
\draw [line width=1mm,black] (3,6) -- ++ (3,6);
\draw [line width=1mm,blue] (-0.4,0) -- ++ (3.25,6.5);

\end{tikzpicture}

\end{document}
Draw a rectangle in TikZ
In TikZ, a rectangle shape can be drawn using its two opposite corners. This can be achieved using relative or absolute coordinates. Here is an example that draws a rectangle using relative coordinates and filled a lightgray color:
\documentclass[border=0.2cm]{standalone}

\usepackage{tikz}

\begin{document}


\begin{tikzpicture}

\draw [line width=1mm,red] (0,0) -- ++ (3,6);
\draw [line width=1mm,black] (3,6) -- ++ (3,6);
\draw [line width=1mm,blue] (-0.4,0) -- ++ (3.25,6.5);

% rectangle
\fill[lightgray] (2,0) rectangle ++(2,12);

\end{tikzpicture}

\end{document}
Scope environment
Now, we need to redraw the same illustration but with a transparency effect for the filled rectangle. This can be achieved by using a scope environment with a shifting option along the x-axis. Here is the corresponding code:
\documentclass[border=0.2cm]{standalone}

\usepackage{tikz}

\begin{document}


\begin{tikzpicture}

% Left side illustration

\draw [line width=1mm,red] (0,0) -- ++ (3,6);
\draw [line width=1mm,black] (3,6) -- ++ (3,6);
\draw [line width=1mm,blue] (-0.4,0) -- ++ (3.25,6.5);

% rectangle
\fill[lightgray] (2,0) rectangle ++(2,12);

% Right side illustration

\begin{scope}[xshift=7cm]
\draw [line width=1mm,red] (0,0) -- ++ (3,6);
\draw [line width=1mm,black] (3,6) -- ++ (3,6);
\draw [line width=1mm,blue] (-0.4,0) -- ++ (3.25,6.5);

% rectangle
\fill[lightgray,opacity=0.5] (2,0) rectangle ++(2,12);
\end{scope}

\end{tikzpicture}

\end{document}
The option xshift=7cm shifts the illustration to the right by 7cm. We have added opacity=0.5 to the rectangle in order to get a transparency effect.
Updated code
It can be optimized by removing the line width option from each \draw command and add it to the tikzpicture environment as a general option. It should be also noted that the black color is a default color, so no need to specify it when we draw the black line
\documentclass[border=0.2cm]{standalone}

\usepackage{tikz}

\begin{document}


\begin{tikzpicture}[line width=1mm]

% Left side illustration

\draw [red] (0,0) -- ++ (3,6);
\draw (3,6) -- ++ (3,6);
\draw [blue] (-0.4,0) -- ++ (3.25,6.5);

% rectangle
\fill[lightgray] (2,0) rectangle ++(2,12);

% Right side illustration

\begin{scope}[xshift=7cm]
\draw [red] (0,0) -- ++ (3,6);
\draw (3,6) -- ++ (3,6);
\draw [blue] (-0.4,0) -- ++ (3.25,6.5);

% rectangle
\fill[lightgray,opacity=0.5] (2,0) rectangle ++(2,12);
\end{scope}

\end{tikzpicture}

\end{document}
At this level, we have reached the end of this tutorial. If you have any questions or remarks, I will be happy to hear from you admin@latexdraw.com.
