In this latex tutorial, we will learn how to use foreach statement for repetitive things when we deal with illustrations using TikZ package. We will highlight the case of a loop with one variable and two variables.

1. Basic usage of \foreach command
Loops are among the most basic and powerful of programming concepts and LaTeX is not an exception. Fortunately, the TikZ package provides \foreach command, which is a similar command to the well know loop For in programming. This command will help us to plot a bunch of similar shapes just by changing a parameter. The basic syntax of the command is:
\foreach var_names in {values_for_each_var}{% sentences inside the loop};
The var_names are the names of the variables that we are going to use, and the values_for_each_var are the values of each variable taken in each loop.
2. Simple Example of \foreach command use
Let’s take a look to an example to understand this better. Suppose we want to plot a set of concentric circles as shown in the next illustration.
One option is to draw it manually and specify the radius and the centre of each circle (10 circles in total with different colours). However we can make it simpler in one line code using \foreach command.

The idea is to start with the big circle and fill it with the cyan colour. Then we draw a smaller circle and we fill it by the cyan colour (90%) and white colour (10%) and we repeat the whole process until we reach the smaller circle. The previous illustration explains different steps where we will use a loop in Latex to avoid repetition. Here is the corresponding code:
\documentclass{standalone}

\usepackage{tikz}

\begin{document}

\begin{tikzpicture}

\foreach \i in {100,90,...,10}{
	\fill[cyan!\i] (0,0) circle (\i*0.01);
}

\end{tikzpicture}

\end{document}
We can see that our variable is named \i and the values that takes goes from 100 to 10. It means that the values are decreasing with a step 10. For every value that the variable takes we draw a circle using the sentence:
\fill[cyan!\i] (0,0) circle (\i*0.01);}
Each circle is plotted with a radius of \i*0.01, it means 0.01 times the value of the variable. Also we have added a fill colour for each circle that is basically the cyan colour but with different saturation values defined by the value of the loop variable .
3. Foreach loop with two variables
In the previous example, we used one variable, but the flexibility of the command allows us to use any number of variables. Here, we consider an example with two variables. The first one is a numeric variable and the second one is an alphabetic variable. Remember that the names of the variables must be declared with a backslash at the beginning. Let’s name the first variable as \i and the second one as \j. The following code shows how to use \foreach with two variables.
\documentclass{standalone}

\usepackage{tikz}

\begin{document}

\begin{tikzpicture}

\foreach \i\j in {1/A,2/B,3/C,4/D,5/E,6/F}
{
	\node[draw,circle] at (\i,0){\Large\j};
}

\end{tikzpicture}

\end{document}

Notice that the values for the variables are separated by a slash /. The first variable defines the x-axis position for the nodes and the second variable defines the label for the node. To draw a circle around the node, we have added draw and circle options to the \node command. After compilation, we get the illustration shown above.
4. How to use a nested loop in TikZ
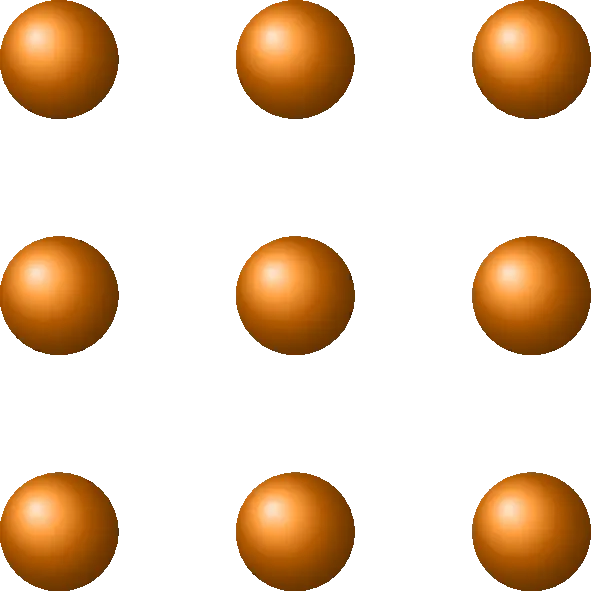
A nested loop is a loop within a loop, an inner loop within the body of an outer one. We can use this kind of loops to get complex graphics. Consider the example of a set of a balls shown in the following illustration together with latex code.

\documentclass{standalone}

\usepackage{tikz}

\begin{document}

\begin{tikzpicture}
\foreach \i in {1,...,3}{
	\foreach \j in {1,...,3}{
		\shade[ball color = orange] (\i,\j) circle (0.25);
	}
}
\end{tikzpicture}

\end{document}
In this example, we have worked with two nested \foreach loops. The first variable named \i defines the row’s position in the plot and the second one named \j defined defines the column’s position. These two variables define the circles’ center coordinates. We have used \shade command to draw balls by using the option ball color=orange. Read more about this command in this post Tikz shading: captain america shield.
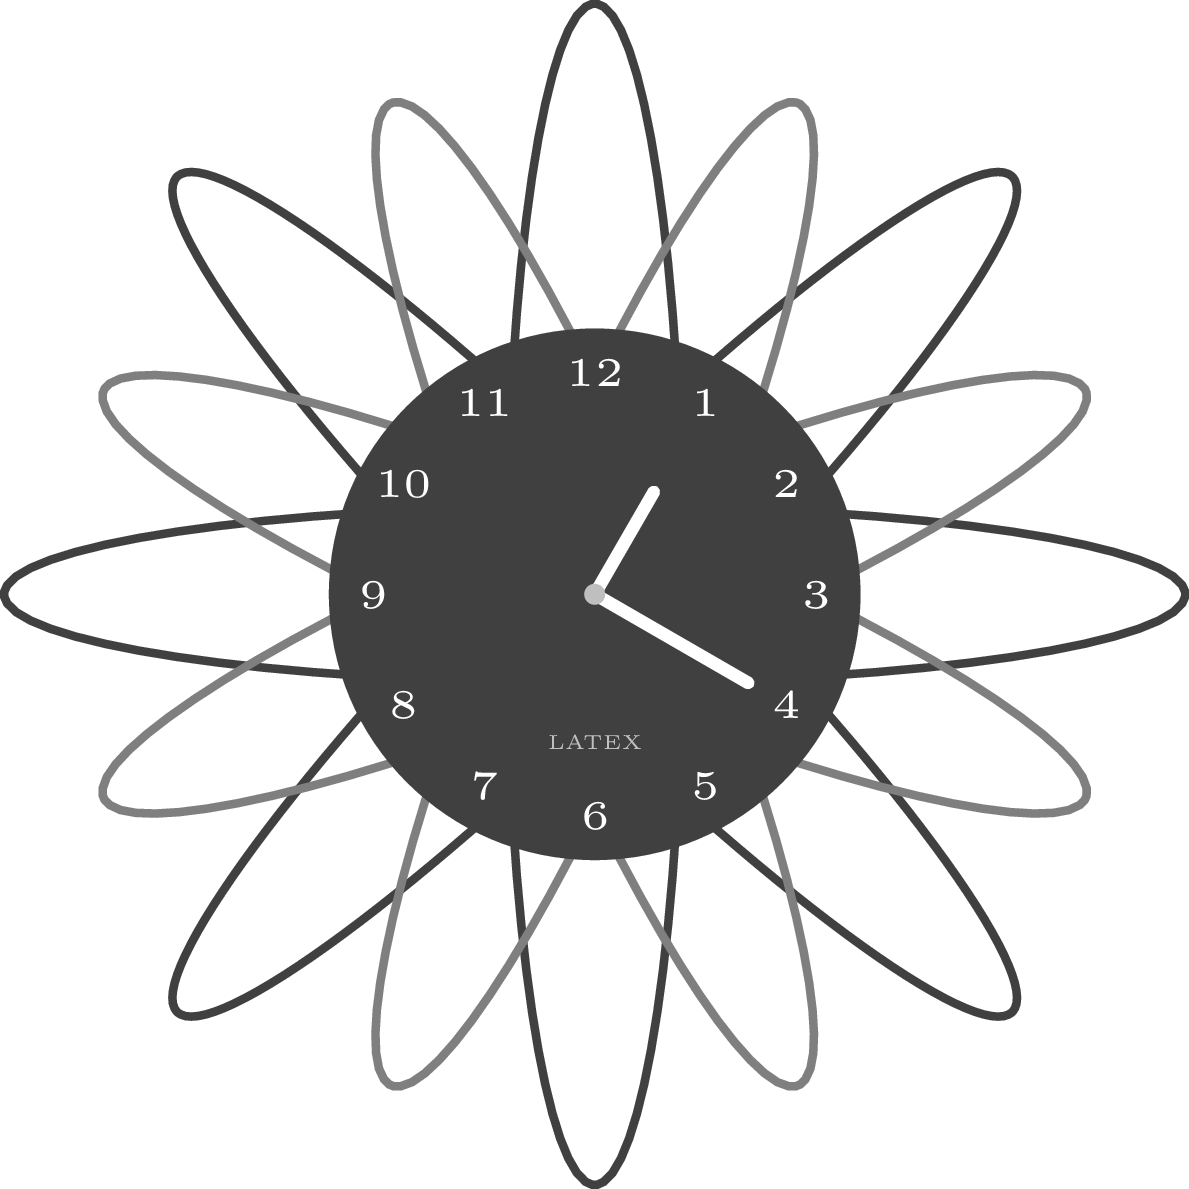
5. Draw an analog clock in LaTeX using TikZ
This part shows how one can draw beautiful illustrations with simple line codes using \foreach command. The following code corresponds to the analog clock that we assume is better than those proposed in this link 

\documentclass{standalone}

\usepackage{tikz}

\begin{document}

\begin{tikzpicture}[scale=1.25]

{\foreach \anglea in {0,45,...,135}
\draw[rotate=\anglea,line width =1pt, draw=black!75] (0,0) ellipse(2 and 0.3);}

\foreach \angleb in {22.5,67.5,...,180}
\draw[rotate=\angleb,line width =1pt, draw=gray] (0,0) ellipse(1.8 and 0.3);
\fill[black!75] (0,0) circle(0.9);
\draw[line width=1.5pt, white,cap=round] (0,0) -- (60:0.4);
\draw[line width=1.5pt, white,cap=round] (0,0) -- (-30:0.6);
\fill[lightgray] (0,0) circle(1pt);
\foreach \angle / \label in {0/3, 30/2, 60/1, 90/12, 120/11, 150/10, 180/9, 210/8, 240/7, 270/6, 300/5, 330/4}
{ \draw (\angle:0.75) node{\tiny{\label}}; }

\node[scale=0.5, text=lightgray] at (-90:0.5) {\tiny LATEX};

\end{tikzpicture}

\end{document}
